
Bank performance data built for bankers.

Benchmark your bank against its peers, track every UBPR ratio, and walk into the next board meeting with the numbers already done.

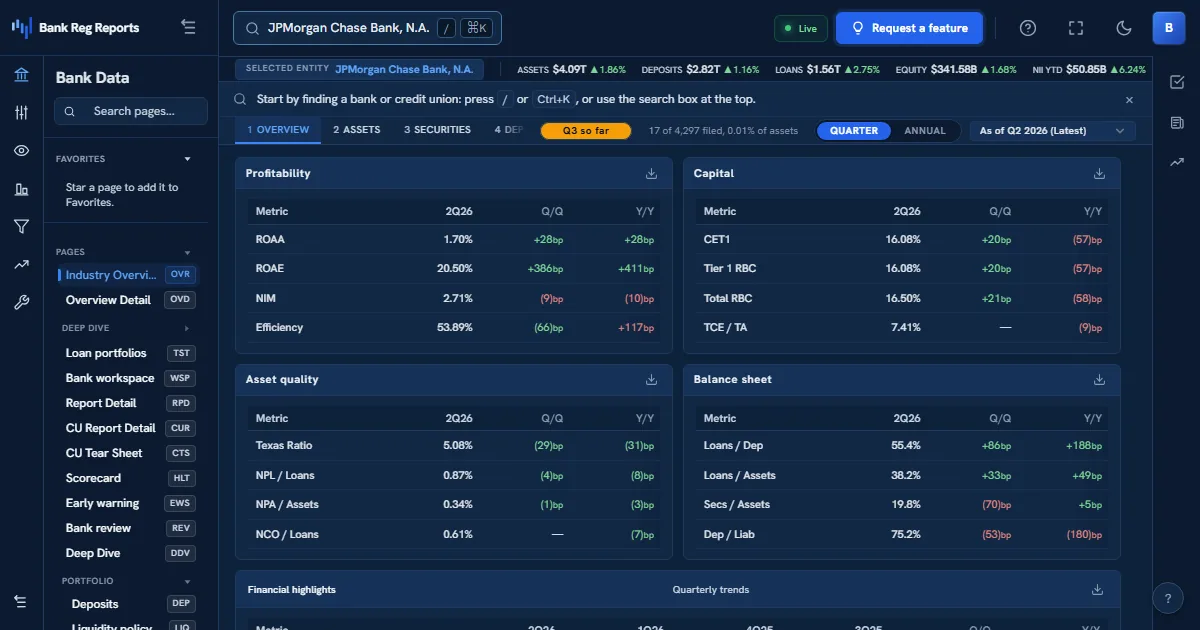
BRR Terminal overview showing profitability, capital, and asset-quality ratio panels with quarter-over-quarter deltas and a total-assets trend chart for a bank.

Bank executives need to know where they stand before the examiner, the board, or the market tells them. BankRegReports turns quarterly FFIEC call report filings, and the UBPR ratios built from them, into instant peer benchmarking, trend analysis, and board-ready scorecards, with Excel tear sheets on the Pro plan, so you spend your time on decisions, not on assembling spreadsheets from bulk regulatory files.

The challenge

  • Pulling peer data out of the FFIEC UBPR system one bank at a time is slow and error-prone.
  • Building a defensible custom peer group takes hours every quarter.
  • Board and ALCO packets need clean, current numbers, not raw schedules.

How BankRegReports helps

Peer benchmarking

Compare margins, efficiency, capital, and credit quality against standard peer groups side by side, or build a custom peer group on your terms (by asset tier, geography, charter, or a hand-picked list) with a free account. By default every bank is ranked against the banks in its asset-size tier, one of six bands.

Compare banks side by side →

Every metric, defined

NIM, efficiency ratio, CET1, Texas Ratio, NCO rates and 25+ more, each with its formula and, where one exists, the supervisory threshold spelled out so the whole team reads them the same way.

Open the glossary →

Board-ready tear sheets

On the Pro plan, export your bank's metric history to CSV or a formatted Excel tear sheet in seconds, current through the latest quarter ingested.

See pricing →

How bankers put it to work

Typical workflows, from the first search to a client-ready or board-ready output.

Walk into the board meeting with the numbers done

It's the week before the board meeting and you need capital, earnings, asset quality, and liquidity trends against peers, not a stack of raw schedules. You build the packet from a live scorecard instead of a spreadsheet.

  1. Search your bank and open the overview scorecard.
  2. Attach a standard or custom peer group so every ratio shows the peer median and your percentile rank.
  3. On the Pro plan, export a formatted tear sheet for the board book.

Prep for the exam before the examiner arrives

You want to see your bank the way supervision will, CAMELS-aligned ratios against peers and, for capital, the regulatory minimums, with any slipping number caught quarters early. You scope your own weak points before fieldwork begins.

  1. Open capital, asset quality, and earnings views with the twelve-quarter trend.
  2. Flag any capital ratio drifting toward its prompt corrective action threshold.
  3. Pull the peer comparison so a genuine outlier is separated from sector-wide movement.

Build a defensible custom peer group once, reuse it every quarter

Your FFIEC default peer group doesn't match how you actually compete. Hand-build the peer set on your terms and it recomputes automatically as each new quarter lands.

  1. Define a peer group by asset tier, geography, charter, or a hand-picked list.
  2. Compare margins, efficiency, capital, and credit quality side by side.
  3. Reuse the same group next quarter, no rebuild, current through the latest cycle.

See it in action

The same views you'll work in, on real FDIC-insured banks, refreshed every quarter.

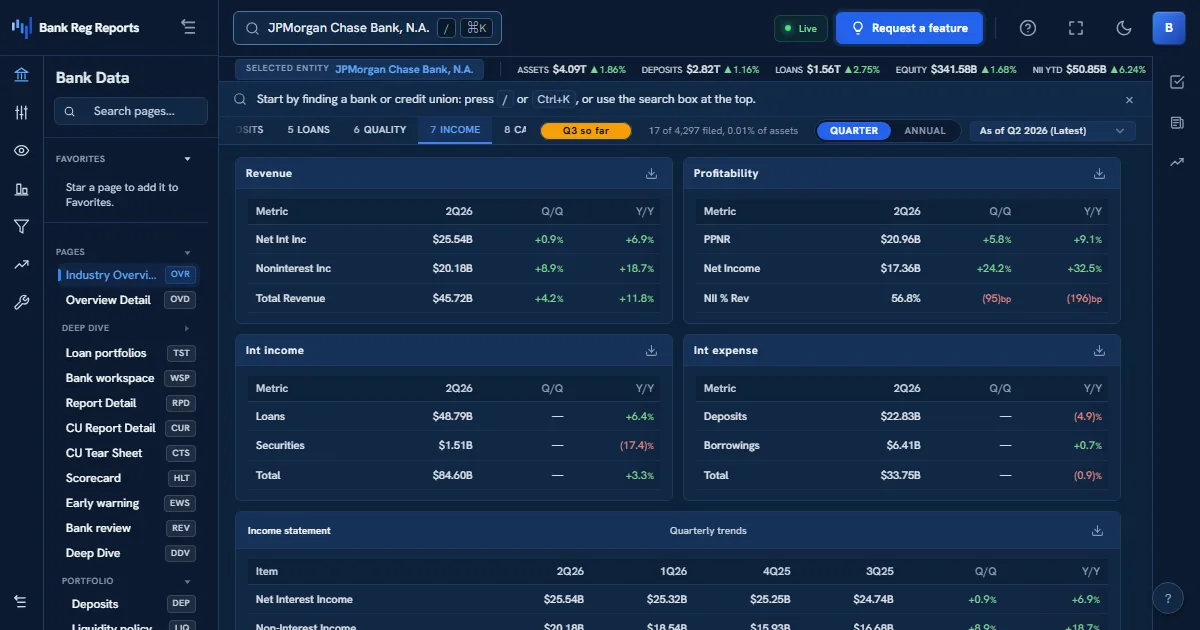
BankRegReports income view showing net interest income, fee income, the efficiency ratio, the full income statement, and a net-income trend for a bank.

Earnings and efficiency, decomposed

Net interest margin, fee income, the efficiency ratio, and pre-provision profitability with the full income statement and trend, benchmarked against your peer group so you know exactly where the margin is being won or lost.

See pricing →

Frequently asked questions

How current is the data?

BankRegReports ingests each quarterly FFIEC call report and UBPR cycle. We load a new quarter within 2 business days of the FFIEC release and pick up amended filings within 7 days. The Data Updates page always shows the most recent quarter loaded and when the pipeline last refreshed.

Can I benchmark against a custom peer group instead of the default peers?

Yes, with a free account. Assemble any custom peer group (by asset size, state, charter type, or a specific list of institutions) and the platform computes the peer medians and your bank's percentile rank against it. By default every bank is ranked against the banks in its asset-size tier, one of six bands.

Which UBPR ratios and call report metrics are covered?

The core supervisory set: NIM, efficiency ratio, ROA, ROE, CET1, Tier 1 leverage, total risk-based capital, Texas Ratio, noncurrent loan ratio, net charge-off rate, allowance (ACL) coverage, loan-to-deposit, and cost of funds among the 892 standardized measures per bank. Each of the core ratios is defined in the glossary with its formula and, where one exists, the level that draws supervisory attention.

Can I export a tear sheet or scorecard for a board or ALCO packet?

Yes, on the Pro plan. Pro exports any bank's metric history to CSV and generates a formatted Excel tear sheet for an individual institution, current through the latest quarter ingested, ready for the board book or ALCO deck without rebuilding it by hand.
See it on your bank

Every FDIC-insured institution, 26+ years of standardized data, one search away.