
Pre-exam intelligence on every bank in the country.

UBPR ratios, CAMELS indicators, asset-quality trends, and peer groups for all 4,187 FDIC-insured institutions, ready before you open the file.

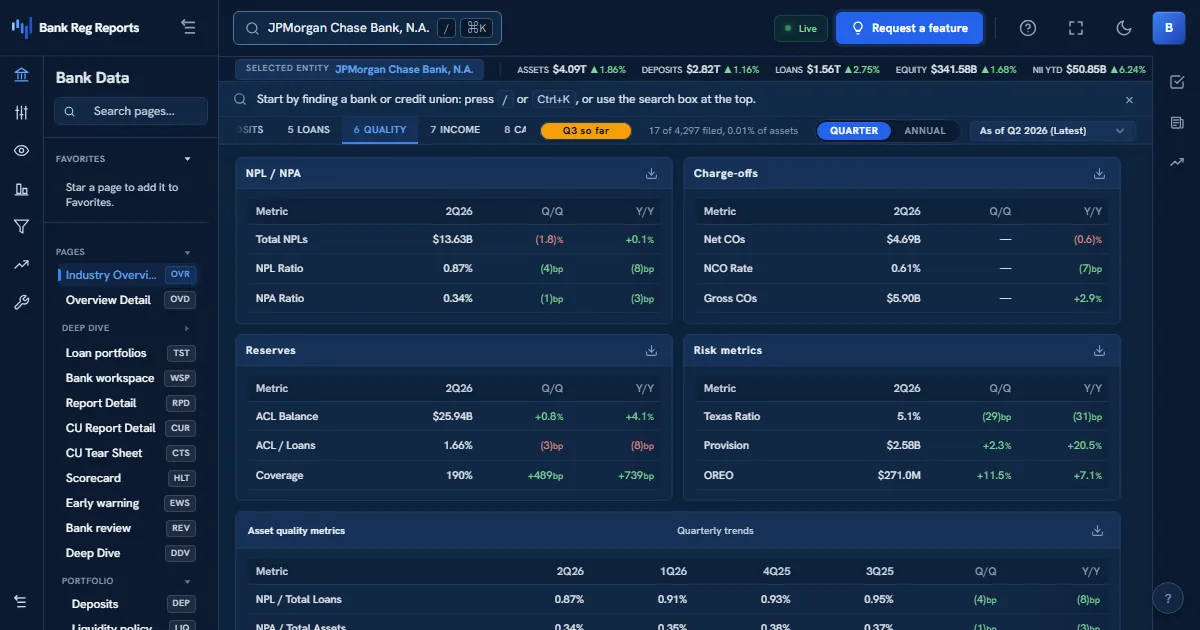
BankRegReports asset-quality view showing noncurrent-loan and NPA ratios, net charge-offs, reserve coverage, the Texas Ratio, and a multi-quarter NPL trend for a bank.

Examiners work against the clock and against a stack of schedules. BankRegReports surfaces the supervisory ratios that matter, capital adequacy, asset quality, earnings, liquidity, and sensitivity, with peer groups and multi-quarter trends so you can scope an examination and flag outliers before fieldwork begins.

The challenge

  • Scoping a bank means cross-referencing several UBPR pages and prior exams.
  • Outliers only matter relative to peers, and building that peer set is manual.
  • Deterioration shows up in trends, not single snapshots.

How BankRegReports helps

CAMELS-aligned indicators

Capital, asset quality, earnings, and liquidity ratios organized the way supervision reads them, with regulatory thresholds where they exist and quarter-over-quarter direction.

Open the glossary →

Instant peer groups

Compare any institution against standard peer groups or your own custom peers to isolate genuine outliers from sector-wide movement.

Compare banks side by side →

Full institution coverage

Every FDIC-insured bank, back to Q1 2000. Search the directory and pull a profile in seconds.

Browse the directory →

How examiners put it to work

Typical workflows, from the first search to a client-ready or board-ready output.

Scope an examination before fieldwork

You're assigned a bank and the clock is running. Instead of cross-referencing several UBPR pages and the prior exam by hand, you pull the supervisory ratios and trends in one pass and know where to dig.

  1. Search the institution and open the CAMELS-aligned indicator set.
  2. Review capital against the regulatory minimums and asset quality, earnings, and liquidity against peers, with the twelve-quarter trend.
  3. Attach an asset-tier or state peer group to flag genuine outliers.

Separate a real outlier from sector movement

A ratio looks alarming, but the whole sector may have moved with the rate cycle. You benchmark against a tailored peer set to decide whether it warrants attention.

  1. Build a peer group matching the bank's size, charter, and footprint.
  2. Compare the flagged metric against the peer median and distribution.
  3. Confirm whether the bank is a true outlier or moving with its peers.

Trace a multi-quarter deterioration

Single snapshots hide the story; deterioration shows up in the trend. You review two decades of standardized history to see where a slide began and how fast it's accelerating.

  1. Open the metric's full quarterly history back to Q1 2000.
  2. Identify the quarter the trend inflected.
  3. Cross-check the related ratios that typically move together.

See it in action

The same views you'll work in, on real FDIC-insured banks, refreshed every quarter.

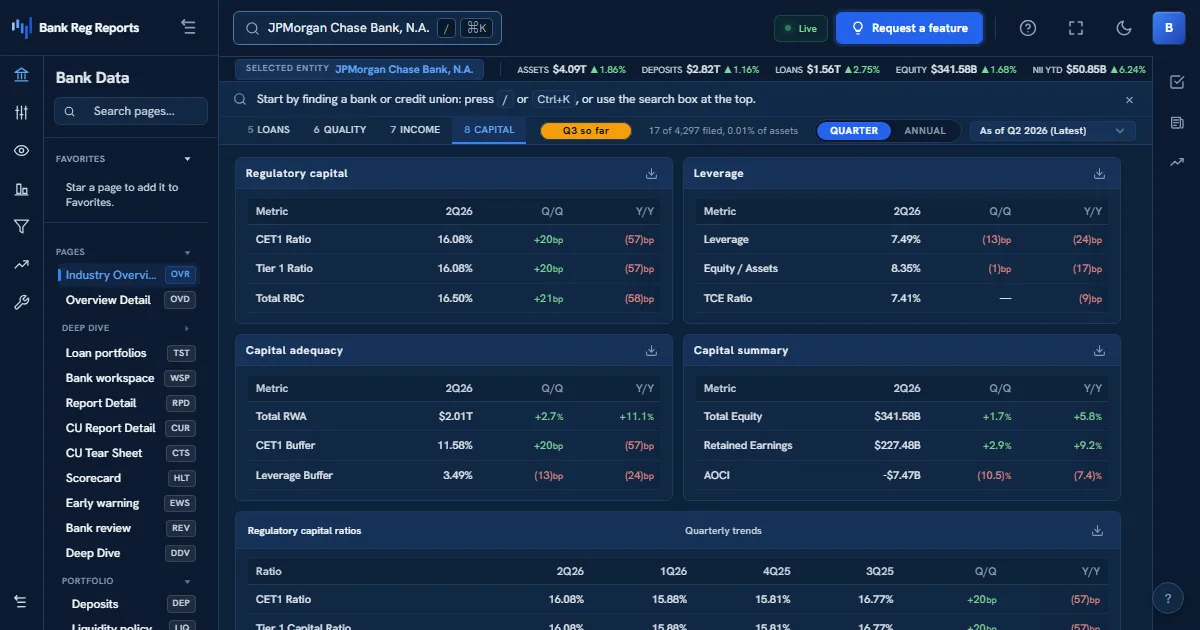
BankRegReports capital view showing CET1, Tier 1 leverage, and total risk-based ratios against regulatory minimums with the cushion and a CET1 trend for a bank.

Capital adequacy against the minimums

CET1, Tier 1 leverage, and total risk-based ratios against the well-capitalized thresholds with the cushion and twelve-quarter trend, capital pressure flagged quarters before it shows up in the next examination.

See the methodology →

Frequently asked questions

Which supervisory ratios are covered?

Capital (CET1, Tier 1 leverage, total risk-based), asset quality (noncurrent loans, NCO rates, allowance (ACL) coverage), earnings (ROA, ROE, NIM, efficiency), and liquidity measures, all sourced from FFIEC call reports and UBPR.

How far back does the history go?

Standardized quarterly data extends back to Q1 2000, so you can review more than two decades of an institution's trend in one place.

Can I build a peer group to isolate outliers during scoping?

Yes. Compare any institution against standard peer groups or a fully custom peer group, and the platform computes peer medians and the bank's percentile rank, so a genuine outlier is separated from sector-wide movement before you open the file.

Does the data reconcile to the official FFIEC filings?

Yes. Every quarterly ingest runs cross-table consistency, units, and outlier checks, and each metric's formula and source schedule is published in the glossary, so the figures trace back to the underlying call report and UBPR.
See it on your bank

Every FDIC-insured institution, 26+ years of standardized data, one search away.