Bank M&A Analysis: How to Evaluate a Deal from Call Reports
The U.S. had 14,000 banks in 1990. It has about 4,300 today. That contraction (mostly mergers, some failures) happened because of a simple arithmetic problem: compliance costs, technology spending, and …
The U.S. had 14,000 banks in 1990. It has about 4,300 today. That contraction (mostly mergers, some failures) happened because of a simple arithmetic problem: compliance costs, technology spending, and funding pressure do not scale with assets the way earnings do, and a $300 million community bank simply cannot buy the same technology stack as a $30 billion regional. The math eventually forces a conversation.
What makes bank M&A analysis unusual is how much of it you can do without ever entering a data room. Every FDIC-insured institution files a standardized call report each quarter: the FFIEC 031 for banks with foreign offices, the FFIEC 041 for most domestic institutions, the FFIEC 051 for smaller banks with simplified reporting. The core schedules and item codes are shared, though the 051 collects a reduced set and the 031 splits consolidated (RCFD) from domestic-office (RCON) columns. That uniformity is what makes systematic bank M&A analysis possible at scale: the same capital, credit, and funding metrics exist for every one of 4,300 institutions, going back decades.
This post walks through how to do that analysis, from screening to diligence to judging deal economics. It is the method post. The current pricing corridors, deposit premium drivers, and 2024 to 2025 deal trends are in the companion post on bank acquisition target benchmarks.
Why the Merger Rationale Shapes the Whole Analysis
Before running a single ratio, ask what the buyer is actually trying to buy. The answer determines which numbers matter.
Efficiency deals, the most common rationale for community bank consolidation, live or die on cost takeout. If the combined efficiency ratio does not improve materially within two years, the deal premium was money left on the table. The target’s non-interest expense base (RIAD4093 on Schedule RI) and staffing cost per asset are the numbers to stress.
Deposit franchise deals turn on something else entirely. A low-cost, sticky core deposit base is arguably the most valuable thing one bank can acquire from another, especially after 2022 reminded everyone what rate risk looks like. Here you care about the target’s cost of interest-bearing deposits, built from the Schedule RI interest-on-deposits components (RIAD4508, RIAD0093, RIADHK03, RIADHK04) over average interest-bearing deposits, the ratio of non-interest-bearing demand to total deposits, and any reliance on brokered or wholesale funding (Schedule RC-E).
Geographic expansion is simpler to evaluate but harder to price. The buyer is paying for market access, not financial performance, which means the deposit franchise and loan pipeline matter more than the trailing efficiency ratio.
Knowing the motive keeps you from over-indexing on the wrong metrics.
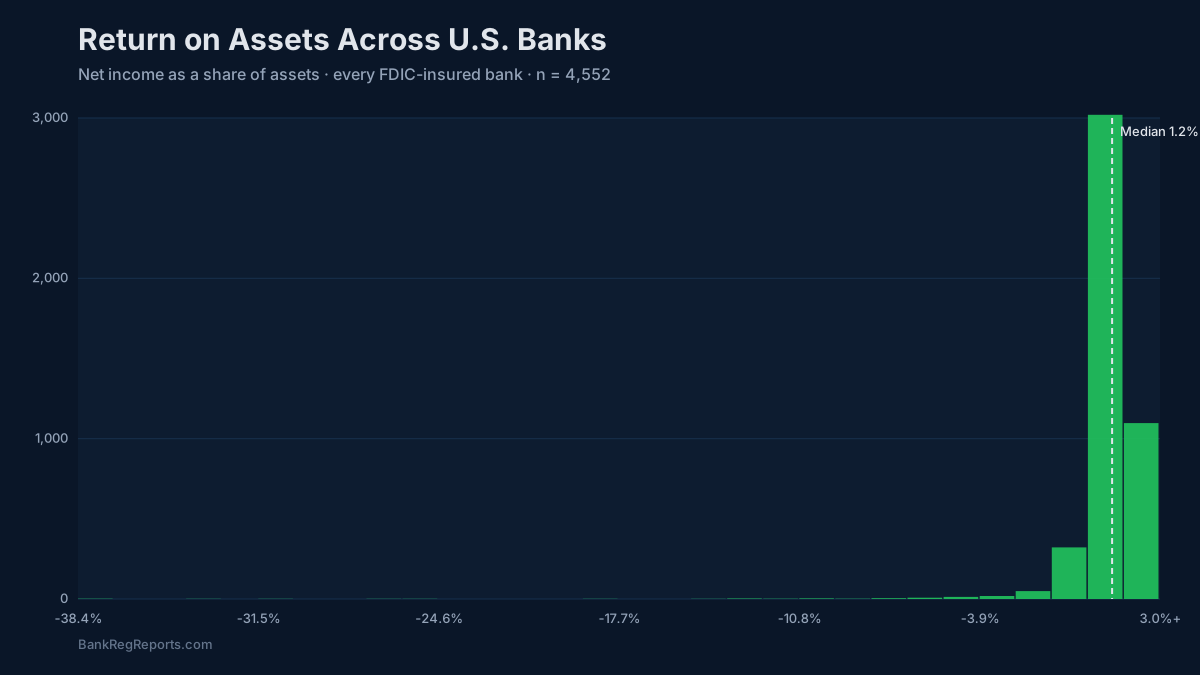
Screening: Narrowing 4,300 Banks to a Shortlist
Systematic target screening starts with filters, not relationships. Call report data lets you cut the universe on objective criteria before a banker ever makes a call.
A reasonable first screen for a community bank acquirer looking to expand by deposit share:
- Total assets: $200M–$1.5B (manageable integration, meaningful scale add)
- Core deposit ratio above 75% (Schedule RC-E non-brokered deposits / total deposits)
- Cost of funds below peer median
- NPL ratio below 1.0% (RCON1403 + RCON1407, nonaccrual plus 90+ days past due and still accruing, divided by total loans)
- CET1 or leverage ratio above well-capitalized thresholds
- Geography within 250 miles of existing footprint
One note on prefixes before you pull anything. The same call report item carries a different prefix depending on which form the bank files. FFIEC 041 and 051 filers report RCON, for domestic offices. FFIEC 031 filers report RCFD on a consolidated basis, and RCFN for foreign offices, so total deposits for an 031 filer is RCON2200 plus RCFN2200 rather than RCON2200 alone. Schedule RC-R left the RCON family entirely in 2014 and now uses RCOA on the 041 and 051 and RCFA on the 031. Query a single prefix and you will silently drop a whole population rather than get an error, and for an RCON-only query that population is the largest banks in the country.
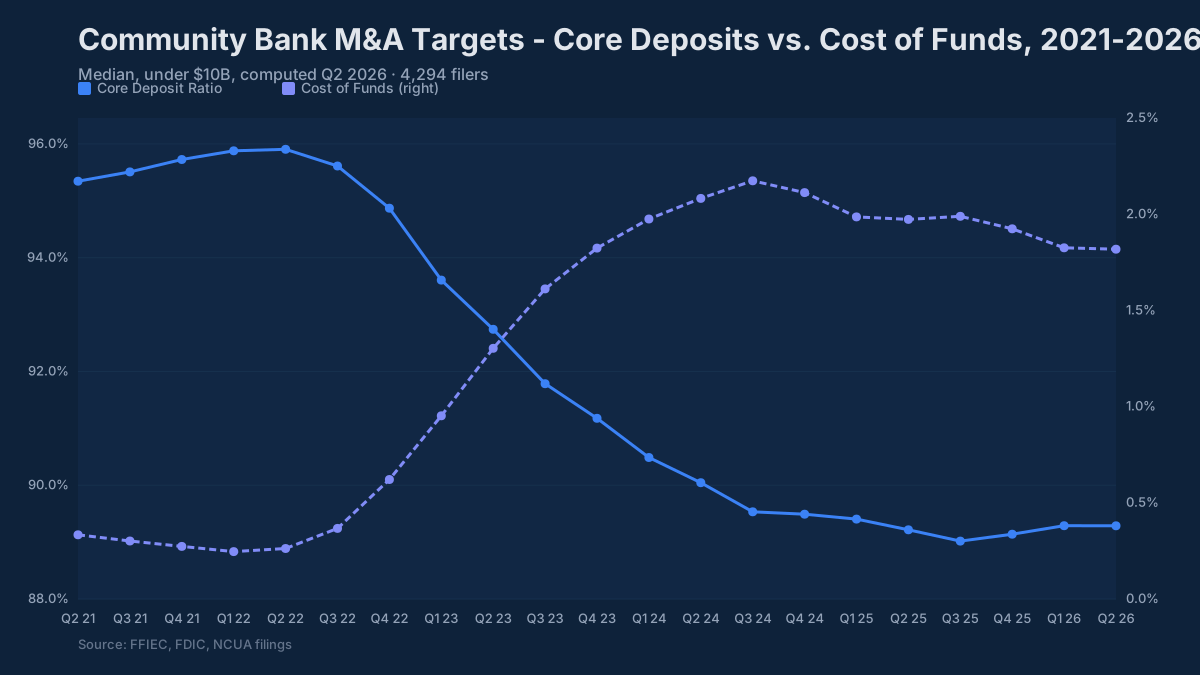
Running this filter through BankRegReports typically produces 40–120 names depending on geography, a manageable shortlist for relationship development.
Diligence: What the Call Report Actually Tells You
Once you have a target, the call report supports a serious independent read of its condition, before you ever see an offering memorandum.
Capital and tangible book value. The CET1 ratio matters, but in M&A the more immediately relevant figure is tangible common equity. Deals are priced as multiples of tangible book, and goodwill created in an acquisition has to be deducted from the buyer’s tangible capital. A target with $50M in TCE might look affordable; but if the deal is priced at 1.5× tangible book, the buyer is absorbing $75M in tangible capital deployment plus the goodwill drag. Work backward from the price to understand the pro forma tangible capital impact on the acquirer.
Loan portfolio quality. Schedule RC-C (Part I) breaks the loan portfolio into categories (C&I, CRE, construction, residential real estate, consumer) that let you map where the credit risk actually lives. Schedule RI-B gives you charge-off and recovery history. RCON1403 (nonaccrual loans) and RCON1407 (loans 90+ days past due and still accruing), both Schedule RC-N item 12 are the two nonperforming buckets to aggregate against total loans. Reserve coverage, RCON3123 (allowance for loan losses) divided by nonperforming loans, tells you how much cushion sits between current marks and real losses.
Hidden credit problems are the single most common source of post-deal disappointment. A target can look clean through the headline NPL ratio if charge-offs were aggressive (shrinking the nonperforming numerator) but future losses are still accruing in the classified/criticized book. Call report data does not show the classified book (that requires exam data), but trending the net charge-off rate ((RIAD4635 minus RIAD4605) / average loans) over 8–12 quarters reveals whether the target has been consistently scrubbing its book or managing the ratio.
Securities book and rate risk. The 2023–2024 cycle made this unavoidable. Schedule RC carries AFS debt securities at fair value (RCON1773) and HTM at amortized cost (RCON1754). To see the unrealized loss, pair amortized cost against fair value in Schedule RC-B, which reports both columns for each security type. The gap between the two is the mark-to-market hit that flows through AOCI and reduces tangible book. In a deal, AFS securities are generally marked to fair value through purchase accounting, which means the buyer effectively absorbs those losses at close. Model this explicitly.
Funding profile. Brokered deposits (Schedule RC-E, Memorandum item 1.b, RCON2365) signal rate sensitivity and potential runoff risk. High non-interest-bearing demand (RCON6631) signals a core franchise that will not reprice. The cost of interest-bearing deposits, built from the Schedule RI components (RIAD4508, RIAD0093, RIADHK03, RIADHK04), compared to peer averages show whether management has been disciplined on funding costs or has been buying deposits.
Deal Economics: Three Tests That Matter
Tangible book value dilution and earnback. Every deal at a premium to tangible book dilutes the buyer’s TBV per share on day one. The earnback period, how many years of incremental earnings it takes to recover that dilution, is the most-used single metric for evaluating deal pricing. Four to five years is the rough market standard for community bank deals; deals stretching past seven years carry real execution risk. Model it with conservative cost save assumptions.
EPS accretion. Will the deal be accretive to earnings per share in year one or two, after cost saves are phased in and merger charges are excluded? Deals that are TBV-dilutive but EPS-accretive immediately can still make sense; the earnback is funded by the incremental earnings. Deals that are both dilutive and flat on EPS require extraordinary cost saves or combined revenue effects to justify the premium.
Pro forma capital. Run the combined bank’s capital ratios after purchase accounting, goodwill creation, and any fair value marks. Regulators expect the combined institution to remain well-capitalized at close. If the deal drops the combined bank below the well-capitalized thresholds, meaning 6.5% CET1, 8% tier 1 risk-based, 10% total risk-based, and 5% leverage, either the price comes down, the deal structure changes, or it does not happen.
The Regulatory Layer
Regulatory approval is not a formality. Both institutions’ CRA performance ratings are on the record. A bank rated “Needs to Improve” or “Substantial Noncompliance” under CRA can delay or sink a merger application; the agencies have explicit authority to weigh it, and they do. Pull the CRA and HMDA data for both institutions early. If there is a problem, you want to know before the deal is announced.
For deals that push the combined institution past $10B in assets, the analysis gets more complex: Durbin Amendment interchange fee limits apply, CFPB examination authority kicks in, and stress testing expectations increase. Cross the $10B line accidentally and you have handed regulators a reason to slow-roll the application.
Deposit concentration in specific markets (HHI analysis) matters in deals with overlapping footprints. The DOJ and banking agencies each run their own version of the competitive screen. Model the deposit market shares in overlapping MSAs or rural counties before closing; divestitures required by regulators can change the deal economics materially.
Frequently Asked Questions
Can you analyze a bank merger using public data? Yes. The standardized quarterly call report filed by every FDIC-insured bank contains the capital, credit, funding, and earnings data needed to screen targets and run a serious independent diligence read, before any confidential information is exchanged.
What metrics matter most in bank M&A? Tangible common equity and the deal premium relative to it, asset quality from Schedule RC-C and RI-B (nonaccrual loans RCON1403, net charge-off rate, gross charge-offs (RIAD4635) less recoveries (RIAD4605)), deposit franchise quality (core deposit ratio, cost of funds from the Schedule RI interest-on-deposits components), the efficiency ratio as a cost-savings baseline, and unrealized AFS securities losses that will mark through at close.
Why do banks merge? Cost efficiency at scale, geographic expansion, acquiring a low-cost deposit franchise, buying specialized lending talent, and ownership succession at small banks. The rationale should drive which metrics you weight most heavily in the analysis.
What is TBV dilution and earnback? Acquisitions at a premium to tangible book value reduce the buyer’s TBV per share on day one from goodwill creation and purchase accounting marks. The earnback period is how many years of incremental deal earnings it takes to recover that dilution. Industry standard for community deals is four to six years; anything beyond seven deserves scrutiny.
How does CRA affect bank mergers? Bank mergers require approval from the OCC, Federal Reserve, or FDIC depending on charter type. Regulators weigh both banks’ CRA performance ratings explicitly. A weak CRA record at either institution can delay or block approval; it belongs in the analysis from day one, not after the merger agreement is signed.
Where can I compare banks for M&A analysis? BankRegReports covers every U.S. bank with 24+ years of quarterly call report history. You can screen the full universe, pull a target’s financial history, and compare two or more institutions side by side across capital, credit, funding, and earnings with peer group benchmarking.
BankRegReports publishes call report, UBPR, FDIC, Federal Reserve, NCUA, and SEC EDGAR data for every U.S. bank and credit union, with peer benchmarks and quarterly history. Look up a bank