What Is the Texas Ratio? A Bank Failure Warning Sign
The Texas Ratio is one of the simplest and most reliable early-warning signals for bank failure. Learn what it measures, how to calculate it from call report data, what level …
When analysts and examiners want a fast read on whether a bank is in trouble, one of the first numbers they reach for is the Texas Ratio. It is simple enough to calculate on the back of an envelope, yet it has flagged a large share of the banks that went on to fail across four decades, which is why it remains a standard first screen. If you only learn one asset-quality metric, this is the one.
This guide explains what the Texas Ratio is, where it came from, how to calculate it from publicly available data, what counts as a healthy versus dangerous level, and how to use it without being misled.
What Is the Texas Ratio?
The Texas Ratio measures a bank’s troubled loans against the resources it has available to absorb losses on those loans. In plain terms, it answers a single blunt question: if the bank’s bad loans went bad all at once, does it have enough capital and reserves to survive?
The ratio compares nonperforming assets (loans that have stopped paying and real estate the bank has seized through foreclosure) to the sum of its tangible equity and its loan loss reserves. When that ratio approaches 100%, it means the bank’s problem assets are roughly equal to the cushion it has to absorb them. Historically, that is the point at which failure risk becomes severe.
The metric is popular precisely because it is intuitive. Capital ratios and risk-weighted asset calculations can be opaque. The Texas Ratio is a straightforward comparison of “how much trouble does this bank have” against “how much can it absorb.”
Where Did the Texas Ratio Come From?
The Texas Ratio was developed by Gerard Cassidy and colleagues at RBC Capital Markets in the 1980s. While analyzing banks during the mid-1980s oil and real estate bust that hammered the Texas economy, Cassidy noticed a striking pattern: banks tended to fail when their nonperforming assets reached parity with their tangible capital plus reserves, a ratio of roughly 1-to-1, or 100%.
Because the pattern first revealed itself among Texas banks during the oil-and-real-estate bust, Cassidy named it the Texas Ratio. The indicator proved its worth again during the early-1990s New England banking crisis, where it once more flagged failures in advance, and it returned to prominence during the 2008–2010 financial crisis as community-bank failures mounted. A metric built on 1980s Texas data has remained one of the most durable failure predictors in banking. (Sources: American Banker; Wikipedia: Texas ratio.)
The Texas Ratio Formula
The standard formula is:
Texas Ratio = (Nonaccrual Loans + Loans 90+ Days Past Due and Still Accruing, each net of its U.S. Government-guaranteed portion, + OREO) ÷ (Tangible Equity + Allowance for Credit Losses)
There is no official regulatory definition, so providers differ at the edges. This is the formula BankRegReports uses, and each input comes straight from the quarterly call report (MDRM codes shown with the RCON prefix; FFIEC 031 filers report the same items with RCFD):
Problem assets (the numerator):
- Loans on nonaccrual status (RCON1403, Schedule RC-N, item 9, column C), less the U.S. Government-guaranteed portion (RCONK041 plus RCONK044, Schedule RC-N, items 11.a and 11.b, column C)
- Loans 90 days or more past due and still accruing (RCON1407, Schedule RC-N, item 9, column B), less the guaranteed portion (RCONK040 plus RCONK043, Schedule RC-N, items 11.a and 11.b, column B)
- Other real estate owned (OREO): property the bank has taken through foreclosure (RCON2150, Schedule RC, item 7)
Tangible equity plus reserves (the denominator):
- Total bank equity capital (RCON3210, Schedule RC, item 27.a) less intangible assets other than mortgage servicing assets (RCON2143, Schedule RC, item 10, less RCON3164, Schedule RC-M, item 2.a)
- The allowance for credit losses on loans and leases (RCON3123, Schedule RC, item 4.c)
The U.S. Government-guaranteed portions of past-due and nonaccrual loans, including rebooked GNMA loans (Schedule RC-N, item 11), are excluded from the numerator, as the UBPR does, so a bank that services government-guaranteed mortgages is not flagged for loans that carry little credit risk. Loans modified for borrowers in financial difficulty are not included. The methodology post explains each input and the judgment calls behind them.
The exclusion of goodwill matters. Goodwill cannot absorb a loan loss; it is an accounting artifact of past acquisitions. Stripping it out gives a truer picture of the real, loss-absorbing capital the bank actually holds.
A Worked Example
Consider a hypothetical community bank:
| Item | Amount |
|---|---|
| Nonaccrual loans (net of guaranteed portion) | $18 million |
| Loans 90+ days past due and still accruing (net of guaranteed portion) | $4 million |
| Other real estate owned (OREO) | $3 million |
| Total problem assets | $25 million |
| Total equity capital | $60 million |
| Less: goodwill and other intangibles | $5 million |
| Tangible equity | $55 million |
| Allowance for credit losses | $20 million |
| Denominator (tangible equity + reserves) | $75 million |
Texas Ratio = $25 million ÷ $75 million = 33.3%
A reading of 33% means the bank’s problem assets equal about a third of its loss-absorbing resources, a comfortable, manageable position. Now imagine nonperforming assets climbed to $70 million while the cushion stayed near $75 million. The ratio would jump to roughly 93%, and the bank would be flashing red.
What Is a Good Texas Ratio? Interpreting the Levels
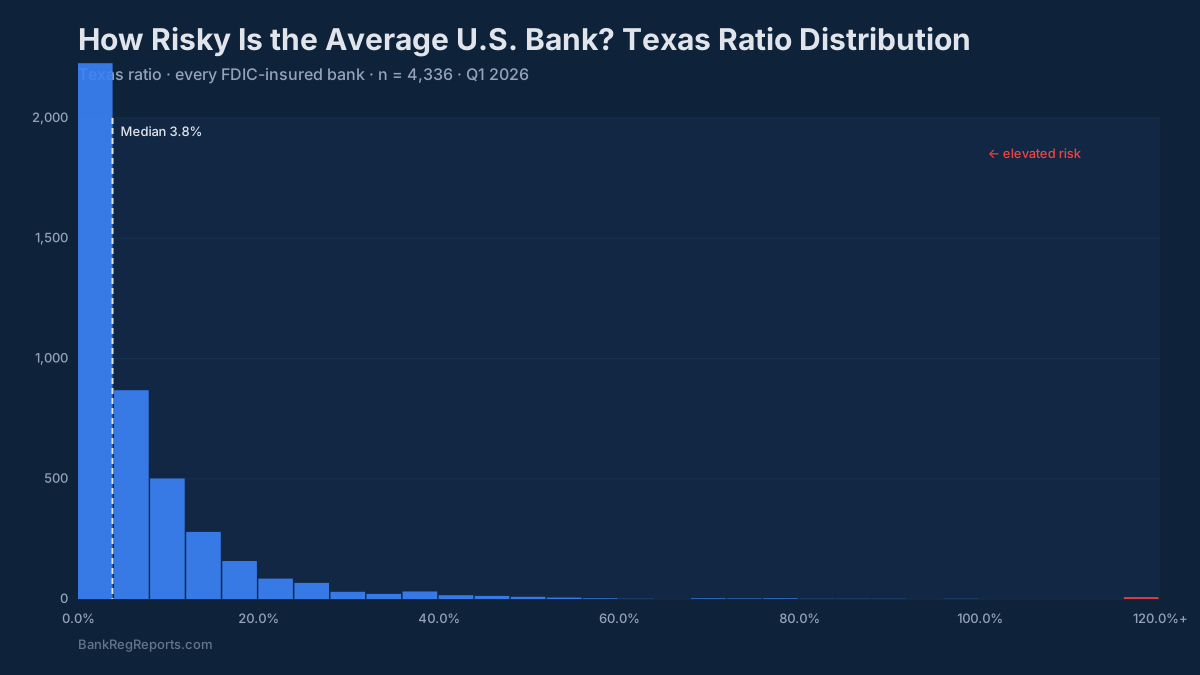
There is no official regulatory threshold, but decades of analysis have produced widely accepted interpretive bands:
| Texas Ratio | Interpretation |
|---|---|
| Below 5% | Very strong asset quality |
| 5% – 25% | Healthy; typical of well-run banks |
| 25% – 50% | Elevated; worth monitoring the trend |
| 50% – 100% | High stress; meaningful failure risk |
| Above 100% | Severe danger; historically associated with failure |
Two cautions apply. First, the trend matters more than the level. A bank moving from 15% to 40% over three quarters is more concerning than one sitting flat at 45%. Second, context matters: a ratio elevated by a single large, well-collateralized credit is different from one driven by broad-based deterioration across the portfolio.
Why the Texas Ratio Works So Well
The Texas Ratio’s predictive power comes from combining the two things that actually kill banks: bad assets and insufficient capital. A bank can carry a lot of problem loans and survive if it is heavily capitalized. A thinly capitalized bank can survive if its loans are pristine. The danger lies in the intersection (significant problem assets and a thin cushion), and that is exactly what the ratio captures in one number.
It is also hard to game. The inputs come from standardized call report schedules that every bank must file, so the figure is comparable across institutions regardless of size, geography, or charter type. That standardization is what makes UBPR-based asset-quality analysis so powerful for peer comparison.
Limitations to Keep in Mind
The Texas Ratio is a screening tool, not a verdict. Its blind spots include:
- It is backward-looking. Nonperforming assets reflect problems that have already surfaced. A bank with rapidly deteriorating but not-yet-delinquent loans can show a deceptively low ratio.
- It ignores collateral quality. Two banks with identical ratios may have very different recovery prospects depending on what secures the bad loans.
- It says nothing about earnings or liquidity. A bank can have a low Texas Ratio and still fail from a deposit run or interest-rate mismatch, as 2023 demonstrated.
- Definitions vary slightly. Some analysts include all OREO; others adjust the numerator or denominator differently. Always confirm how a given source defines the inputs before comparing figures.
For these reasons, experienced analysts pair the Texas Ratio with capital ratios, net charge-off trends, and funding analysis rather than relying on it alone.
How to Find the Texas Ratio for Any Bank
Because every input comes from the call report, you can compute the Texas Ratio for any of the roughly 4,350 FDIC-insured institutions in the country. (As of the FDIC’s Q1 2026 Quarterly Banking Profile, 4,353 institutions reported, per FDIC.gov.) The challenge is assembling the components and tracking them over time.
BankRegReports calculates the Texas Ratio automatically for every U.S. bank, charts it across more than 25 years of quarterly history, and lets you benchmark it against custom peer groups, so you can see not just where a bank stands today, but whether its asset quality is improving or quietly eroding. If you are a depositor simply asking whether your bank is safe, the Texas Ratio is one of the clearest signals to start with.
Frequently Asked Questions
What is a good Texas Ratio for a bank? A Texas Ratio below 25% is generally considered healthy, and below 5% is very strong. Ratios between 50% and 100% indicate significant stress, and a ratio above 100% has historically been associated with a high probability of bank failure.
How is the Texas Ratio calculated? The Texas Ratio equals problem assets (nonaccrual loans and loans 90 or more days past due and still accruing, each net of its U.S. Government-guaranteed portion, plus other real estate owned) divided by tangible equity plus the allowance for credit losses on loans and leases. All inputs come from the bank’s quarterly call report.
Who created the Texas Ratio? The Texas Ratio was developed by Gerard Cassidy and colleagues at RBC Capital Markets in the 1980s, after observing that Texas banks tended to fail when nonperforming assets approached the level of their tangible capital plus reserves.
Does a Texas Ratio over 100% mean a bank will fail? Not automatically, but it is a serious warning sign. A ratio above 100% means a bank’s problem assets exceed its loss-absorbing cushion. Historically, the large majority of banks reaching this level have failed or required intervention, though strong recoveries on collateral or capital injections can change the outcome.
Where can I find a bank’s Texas Ratio? Because the inputs are public call report data, the Texas Ratio can be calculated for any FDIC-insured bank. BankRegReports computes it automatically for every U.S. bank with historical trends and peer comparisons.
What is the difference between the Texas Ratio and a capital ratio? A capital ratio measures capital against assets or risk-weighted assets. The Texas Ratio specifically compares troubled assets to the capital and reserves available to absorb them, making it a more targeted measure of asset-quality stress.