The Allowance Coverage Ratio: How to Judge a Bank's Reserve Adequacy
A bank can hold $50 million in reserves and still be dangerously thin. The dollar figure is nearly meaningless without context — specifically, what those reserves are measured against. That's …
A bank can hold $50 million in reserves and still be dangerously thin. The dollar figure is nearly meaningless without context — specifically, what those reserves are measured against. That’s the job of the allowance coverage ratio: it forces that comparison, and it’s one of the first places an examiner or credit analyst goes when assessing whether a bank’s reserve position is genuine or cosmetic.
The core idea is straightforward. A bank’s allowance for credit losses (ACL) — formerly the ALLL under the incurred-loss model, now the ACL under CECL — is its reserve against expected loan losses. The allowance coverage ratio tells you how much of the relevant loan exposure those reserves actually cover. There are two versions, and they answer meaningfully different questions.
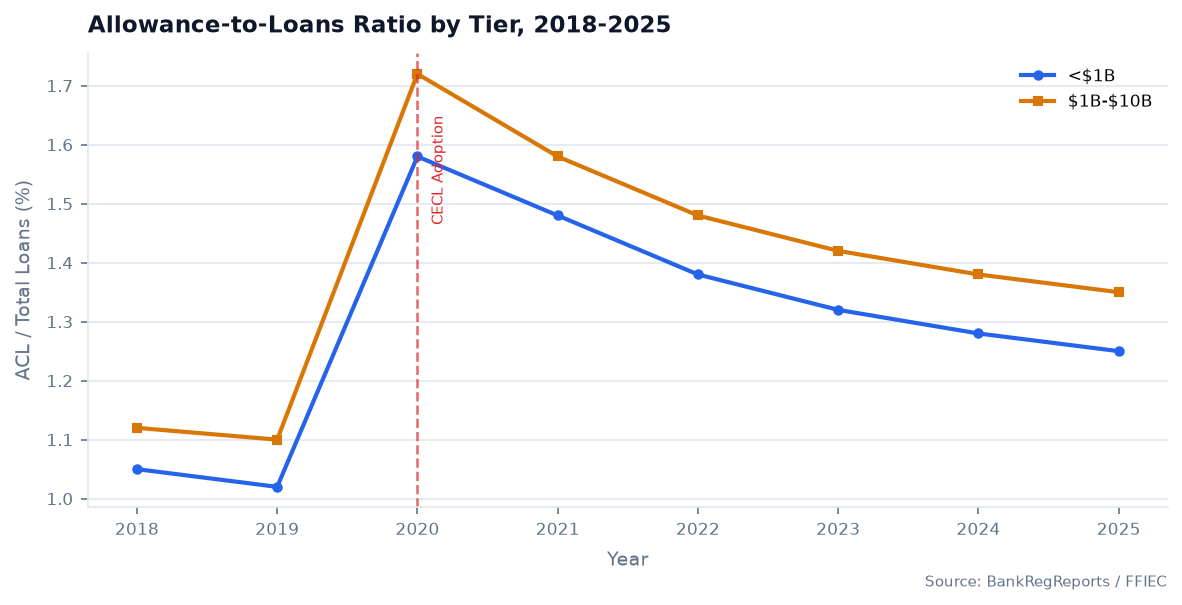
CECL adoption created a visible step-change in these ratios that still confuses peer comparisons when banks in the same cohort adopted on different schedules.
The Two Measures and What Each Actually Tests
Allowance-to-Loans Ratio = ACL ÷ Total Loans
This is the broad coverage measure. On the call report, the ACL is reported at RCON3123 (or its Schedule RC-C equivalent) and total loans at RCON2122. The ratio tells you what percentage of the entire loan book is reserved against expected losses.
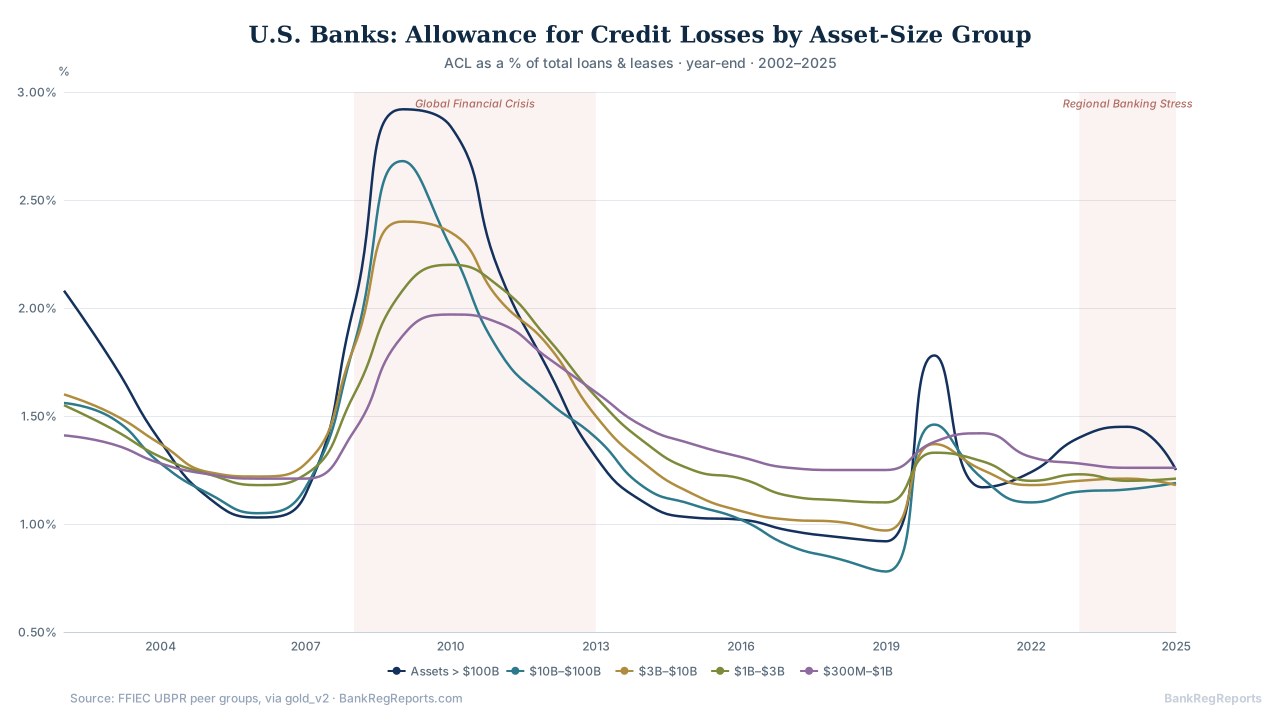
Under CECL (ASC 326), this ratio is structurally higher than it was under the incurred-loss model — reserves are now required at origination for lifetime expected losses, not just after losses become probable. A ratio that looked high at 1.8% in 2019 might be perfectly ordinary for a CECL-adopter today. This matters enormously for cross-period comparisons and for comparing banks that adopted at different times.
Coverage of Nonperforming Loans = ACL ÷ Nonperforming Loans
This is the sharper test. Nonperforming loans — loans 90+ days past due or on nonaccrual, reported on Schedule RC-N and summarized at RCON5525 — are the loans that have already declared themselves troubled. Dividing reserves by that figure tells you how many cents of reserves the bank holds per dollar of already-impaired loans.
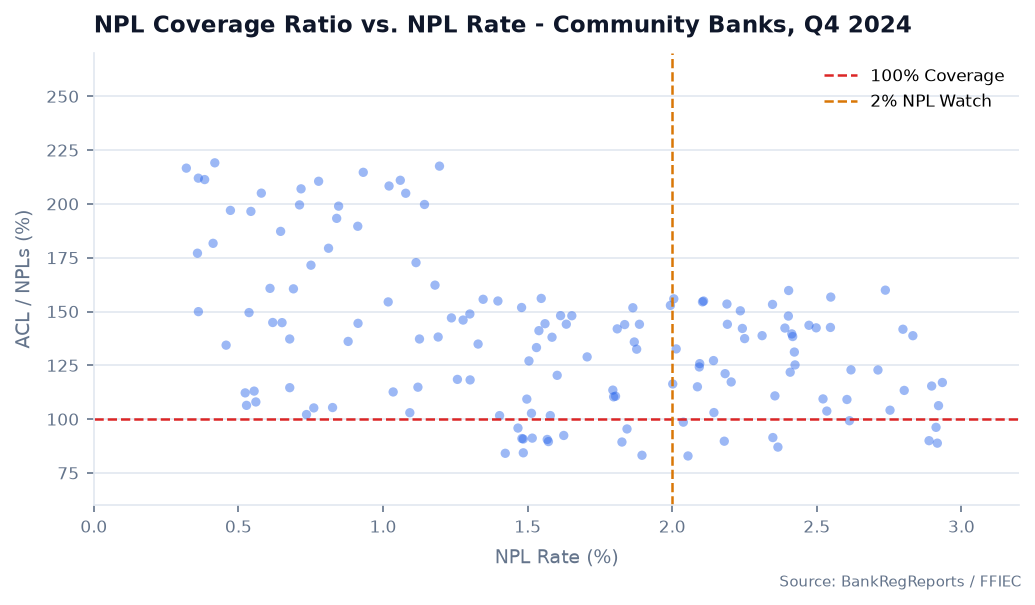
Coverage above 100% means the bank holds more in reserves than it has in troubled loans. Coverage below 100% means it doesn’t — and any further deterioration in those loans comes directly out of capital.
A Worked Example Worth Walking Through
| Item | Amount |
|---|---|
| Allowance for credit losses (RCON3123) | $20 million |
| Total loans (RCON2122) | $720 million |
| Nonperforming loans (RCON5525) | $15 million |
| Allowance-to-loans ratio | 2.78% |
| Coverage of nonperforming loans | 133% |
Solid position. The bank reserves about 2.8 cents per dollar of loans and holds $1.33 in reserves per dollar of troubled loans.
Now stress it: nonperforming loans double to $30 million, allowance stays flat. Coverage drops to 67%. The reserves no longer cover even the impaired book, let alone anything migrating toward it. That’s not a theoretical scenario — it’s what happened to hundreds of banks between 2008 and 2011, and to a smaller cohort in specific CRE concentrations post-2022.
Reference Points for Healthy Coverage
There’s no single right number. Loan mix dominates. A bank heavy in C&I and construction will reserve at higher rates than one concentrated in 1-4 family residential mortgages — the loss history and migration patterns are categorically different.
| Measure | Comfortable range | Pay attention when… |
|---|---|---|
| Allowance-to-loans | ~1.2% – 2.5% (CECL era) | Falling while loan balances grow fast |
| Coverage of nonperforming loans | Above 100%, ideally 120%+ | Approaching or crossing below 100% |
The 100% threshold on NPL coverage is the hard floor. Peer comparison matters more than any absolute benchmark, and the UBPR peer tables exist precisely because the relevant comparison for a $600 million agricultural bank is not JPMorgan Chase.
How to Use Coverage Ratios as a Warning System
Levels matter less than trends. The patterns that should stop you:
Falling NPL coverage while nonperforming loans climb. If the numerator (ACL) is flat or declining and the denominator (NPLs) is rising, the bank is losing ground. Management may be provisioning at a rate that flatters current-period earnings — it shows up as a controlled provision for credit losses in Schedule RI while reserve coverage quietly erodes.
NPL coverage below 100%. When this happens, the bank’s stated reserves don’t cover the loans already known to be impaired. Additional charge-offs or migration from the watch list go directly to capital. That’s a materially different risk profile than a bank at 150%.
Allowance-to-loans ratio shrinking during rapid loan growth. Adding $200 million in new loans while the allowance grows $1 million suggests the bank is not reserving for the risk it’s adding — either because management believes the new book is pristine or because provision expense is being managed to a target income number. Both possibilities deserve scrutiny.
Sustained gap below peer median. One quarter below peers is noise. Four or five consecutive quarters is a pattern. BankRegReports tracks this by peer group, including the custom cohorts that matter for community bank analysis — same asset tier, same state, similar loan mix.
Pulling the Data Directly
Both coverage ratios can be computed from call report data. The BankRegAPI surfaces these pre-calculated, with full quarterly history.
from bankregreports import BankReg

client = BankReg("brr_your_key_here")

# Pull allowance coverage metrics for a specific bank
coverage = client.bank_metrics(
    rssd_id=1031715,          # Example: First National Bank
    metrics=[
        "allowance_to_loans",         # ACL / Total Loans
        "npl_coverage_ratio",         # ACL / Nonperforming Loans
        "provision_to_avg_loans",     # Annualized provision rate
        "net_charge_off_rate",        # NCOs as % of avg loans
    ],
    start_date="2020-01-01",
    include_peers=True,               # Returns peer median alongside
)

# coverage.data[0]
# {
#   "report_date": "2025-12-31",
#   "allowance_to_loans": 0.0182,        # 1.82%
#   "npl_coverage_ratio": 1.24,          # 124% — $1.24 reserved per $1 NPL
#   "provision_to_avg_loans": 0.0041,
#   "net_charge_off_rate": 0.0038,
#   "peer_npl_coverage_ratio": 1.31,     # Peer median: 131%
# }
The full endpoint documentation is at api.bankregreports.com/api/v1/docs/.
Where Coverage Fits in the Asset-Quality Chain
Reserve coverage doesn’t live in isolation. Nonperforming loans are the leading signal — they show you what’s already broken. Coverage tells you whether reserves are sized to absorb it. The provision for credit losses (RIAD4230 on Schedule RI) is what management uses to build or deplete the reserve. Net charge-offs are the losses reserves actually absorb, reported on Schedule RI-B at RIAD4635.
A bank that provisions aggressively builds coverage. A bank that under-provisions — whether from genuine optimism or earnings management — erodes it. You can usually distinguish the two by looking at how coverage moves relative to NPL migration. If NPLs are rising and the provision isn’t keeping pace, coverage is falling for a reason. If NPLs are stable and coverage is still declining, the bank is releasing reserves into income. Both are worth understanding before drawing a conclusion.
Frequently Asked Questions
What is the allowance coverage ratio? It compares a bank’s allowance for credit losses to the loans it covers. The two main forms are the allowance-to-loans ratio (ACL divided by total loans) and coverage of nonperforming loans (ACL divided by NPLs). Together they measure whether reserves are adequate relative to the loan book and its problem credits.
What is a good allowance coverage ratio? For NPL coverage, 100% is the floor — reserves should at least match impaired loans, and most well-run banks carry a buffer above that. For allowance-to-loans, healthy levels depend on loan mix and the credit cycle; a residential mortgage bank will reserve at much lower rates than a C&I or construction lender. Peer comparison is the only meaningful benchmark.
What does coverage of nonperforming loans below 100% mean? Reserves don’t cover the bank’s already-troubled loans. Any further charge-offs or deterioration beyond what’s reserved comes directly out of capital. It’s not automatically a crisis, but it’s a material warning sign that demands an explanation.
How can I identify an under-reserved bank? Look for three things together: NPL coverage trending down, the allowance-to-loans ratio falling while the loan book grows, and both measures running below peer medians for multiple quarters. A bank doing all three while reporting strong earnings is often managing the provision to a number rather than to the risk.
How does the allowance coverage ratio connect to the provision for credit losses? The provision (Schedule RI, RIAD4230) is what builds the allowance each quarter. Net charge-offs deplete it. If the provision consistently runs below the NCO rate, the allowance shrinks and coverage falls. Tracking that gap over several quarters is more informative than any single period’s coverage ratio.
Where can I find this data? The source data is in the call report (FFIEC 031/041/051) and the UBPR peer tables. BankRegReports calculates both coverage measures for every U.S. bank, with quarterly history back through multiple credit cycles including the CECL transition.
The one thing worth doing after reading this: pull NPL coverage for a bank you cover or compete against and run it back eight quarters. If it’s been compressing while NPLs have been stable, someone is making a decision not to provision. That decision has a consequence.
The data referenced in this post is available through the BankRegReports Data API. The BankRegAPI Python SDK (pip install bankregreports) returns clean, UBPR-validated data from FFIEC, FDIC, Federal Reserve, NCUA, and SEC EDGAR in a single call. Get a free API key →