Noninterest Income: Benchmarks, Examiner Focus, and Fee Mix
Across community banks in aggregate, noninterest income accounts for roughly 15–20% of total revenue; at the median community bank it is closer to 10%. A few high-performing institutions, particularly those …
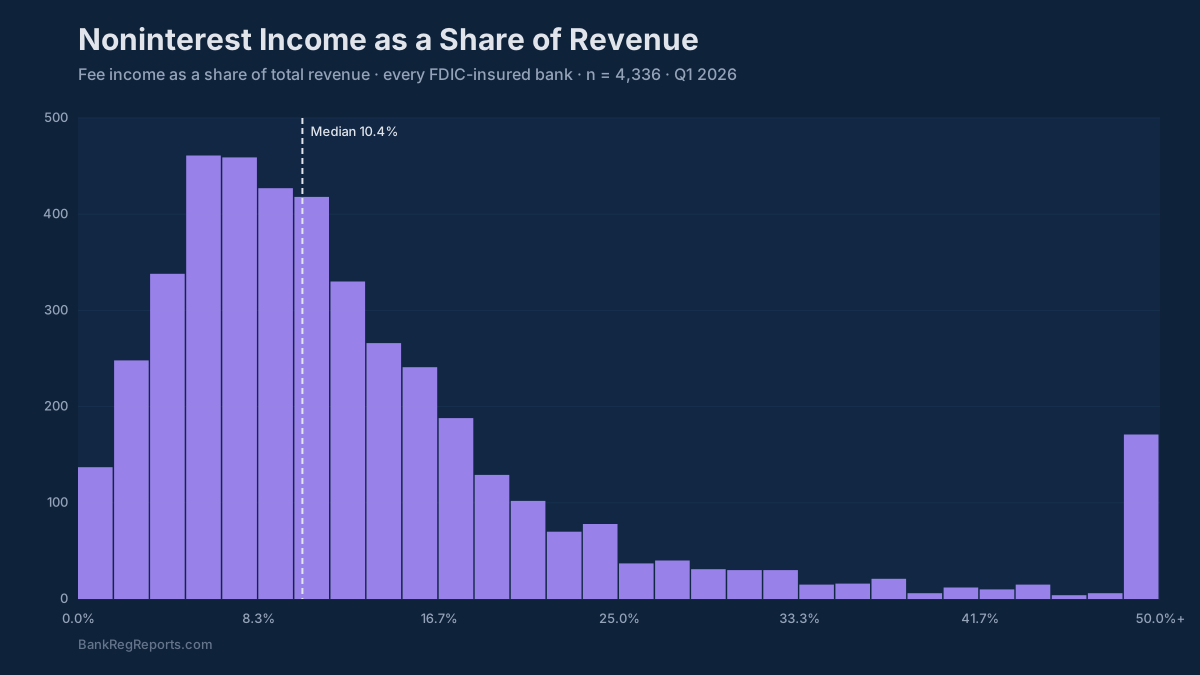
Across community banks in aggregate, noninterest income accounts for roughly 15–20% of total revenue; at the median community bank it is closer to 10%. A few high-performing institutions, particularly those with trust departments, SBA lending programs, or strong mortgage banking operations, push that above 30%. The bottom quartile sits below about 6%, almost entirely dependent on the spread. That gap matters most when net interest margin is compressing.
Fee income is not a bonus on top of spread income. For banks that have built it deliberately, it is the buffer that keeps ROA above 1.0% when rates go sideways and deposit competition tightens. For banks that have not, the 2023–2024 margin squeeze exposed exactly how thin the revenue base was.
This post covers what noninterest income is, what the components signal about a bank’s business model, where the examiner focus sits, and what benchmarks to use when you are comparing your institution against peers.
What Noninterest Income Is, and What It Tells You
Noninterest income is every dollar of revenue that does not come from interest on loans or securities. It flows through Schedule RI of the call report and sits alongside net interest income as one of two components of total operating revenue.
The split between net interest income and fee income is one of the most revealing single data points about a bank’s business model. A $1B community bank with 25% of revenue from fees has a fundamentally different risk profile, and a different conversation with its board and examiners, than one sitting at 8%.
Community banks by asset tier show predictable patterns. Banks under $500M tend to run the lowest fee ratios: the customer base is smaller, trust and wealth services are often absent, and mortgage banking operations are modest. Banks in the $1B–$10B range that have invested in treasury management, wealth advisory, or SBA lending can reach fee ratios near 20% or more, against a tier median of about 14%. The fee income ratio is partly a function of size and partly a strategic choice.
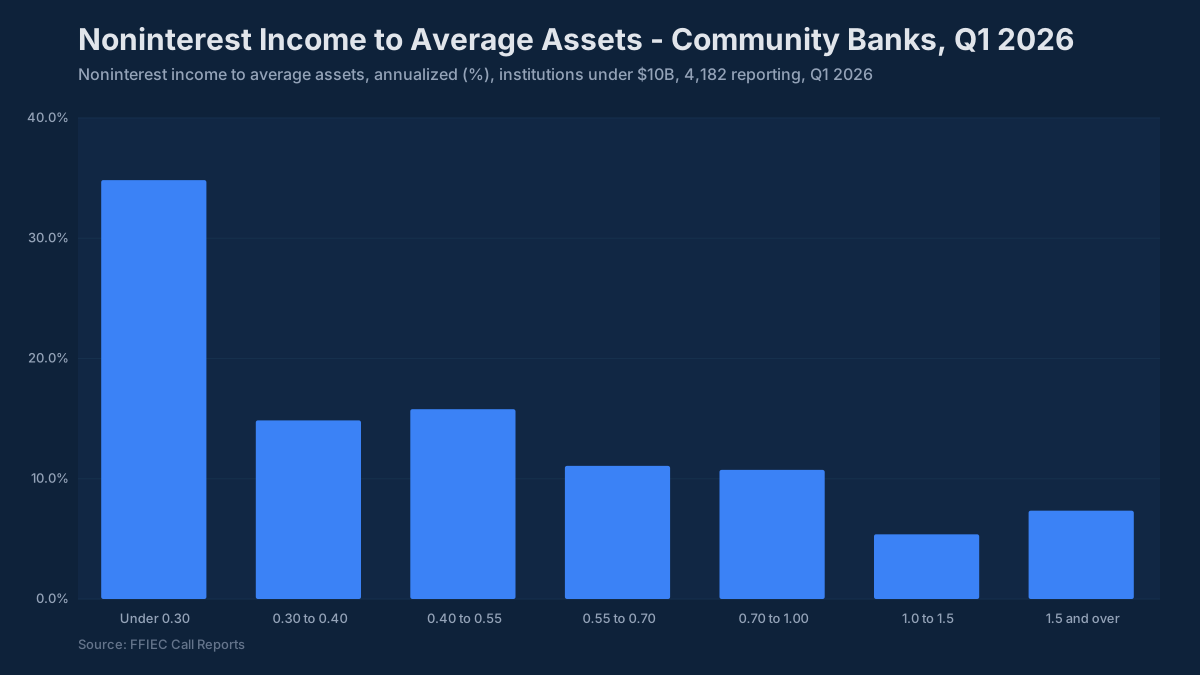
The UBPR presents noninterest income as a percentage of average assets, typically about 0.25% to 0.70% for community banks, with a median near 0.40%. Trust-heavy institutions routinely exceed 1.0%. A bank running below 0.30% is almost entirely spread-dependent and needs a clear-eyed board discussion about revenue concentration risk.
The Main Fee Categories and What Each One Signals
Not all fee income is equal. Examiners and analysts who dig into the composition of noninterest income are reading something specific about the bank’s model, its customer relationships, and its earnings quality.
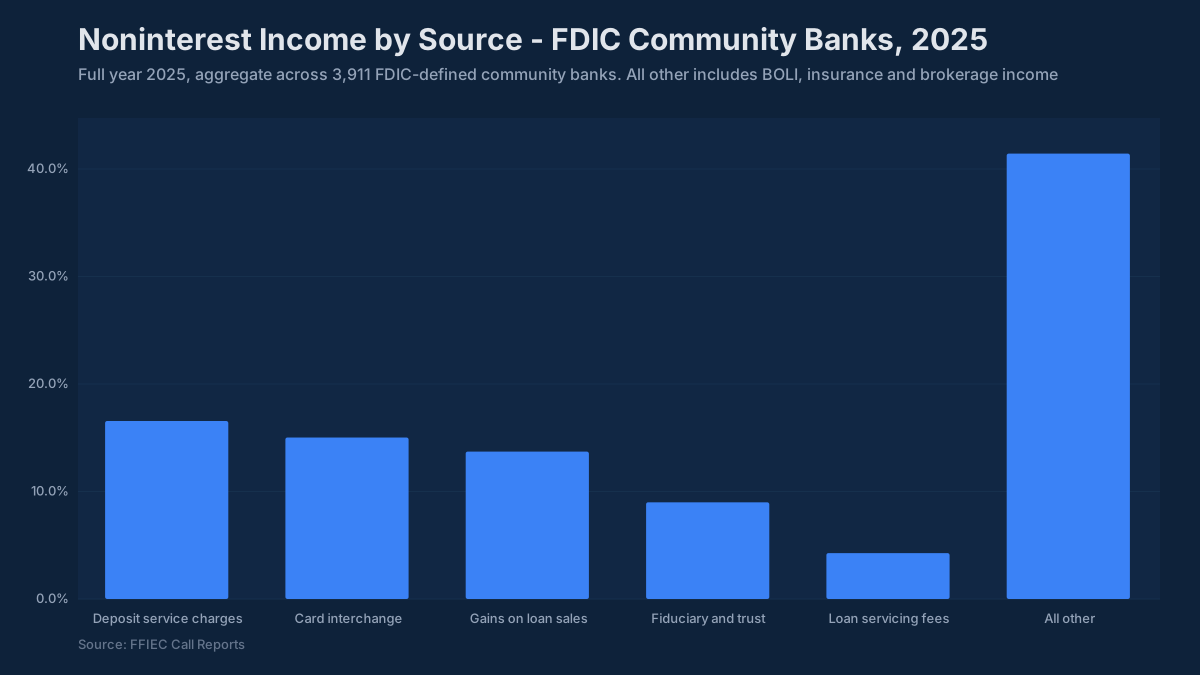
Service charges on deposit accounts are the most common source for community banks. These include monthly maintenance fees, overdraft charges (NSF/OD fees), and account analysis charges from commercial customers. Historically the largest fee category for many community institutions, this line has faced sustained pressure: regulatory focus on overdraft practices, consumer behavior shifts, and competitive dynamics from fintech have all taken bites out of it. Banks that had 40–50% of their fee income concentrated in overdraft revenue heading into the 2020s have had to rethink that model.
Interchange and card-related income (debit and credit card interchange) is a recurring, transaction-driven revenue stream that scales with deposit account volumes and card activation rates. For banks under $10B in assets, interchange is not subject to the Durbin Amendment caps that apply to larger institutions, which gives community banks a meaningful structural advantage here. A well-managed community bank with strong debit penetration can generate 0.10–0.15% of average assets in card income alone.
Wealth management and trust fees are the gold standard for fee income quality: recurring, relationship-based, not interest-rate sensitive, and capital-light. A bank with a mature trust department or a productive fee-based advisory platform running 0.15–0.25% of assets in wealth fees is in a very different position than a bank without one. These fees tend to hold up in recessions and across rate cycles. Examiners and analysts view them favorably as a signal of earnings durability.
Mortgage banking income is the most cyclical major fee category. Gain-on-sale margins and origination volumes collapse in rising-rate environments, exactly what happened in 2022–2023, when many community banks saw this line drop 50–70% from 2021 peaks. Banks that built out mortgage banking operations during the low-rate era learned this the hard way. If mortgage banking was more than 20–25% of your fee income heading into 2022, your total revenue took a visible hit. That is not a reason to avoid mortgage banking; it is a reason to model the revenue volatility explicitly in ALCO and plan for it.
Treasury management and commercial service fees (cash management, ACH origination, wire transfer, remote deposit, account analysis credits) are some of the most strategically important fee income sources for commercial banks, but they are frequently underpriced and undercounted. These fees are sticky: a commercial customer that runs payroll through your bank’s ACH platform is not leaving easily. Banks that have invested in treasury management sales capabilities often generate 0.05–0.10% of average assets in this category, with strong relationship retention as a secondary benefit.
SBA and USDA loan sale premiums are a specialized but high-value source for banks active in government-guaranteed lending. Selling the guaranteed portion of SBA 7(a) loans generates gain-on-sale income that can be significant for active shops, often 5–10% or more of the guaranteed portion at typical market premiums. This is also interest-rate sensitive (secondary market premiums compress when rates rise and spread tightens), but less so than residential mortgage banking.
Benchmarks That Matter
When your board asks how the bank’s fee income compares to peers, these are the numbers that belong in the conversation:
| Metric | Typical Community Bank | Strong | Concerning |
|---|---|---|---|
| Noninterest income / average assets | 0.40–0.65% | >0.80% | <0.25% |
| Noninterest income / total revenue | 6–15% (median about 10%) | >20% | <5% |
| Service charges / total fee income | 20–40% | — | >60% (concentration) |
| Wealth/trust fees / total fee income | 0–20% | >20% | — |
| Mortgage banking / total fee income | 10–25% | — | >30% (cyclicality) |
The “concerning” thresholds are not hard trip wires; they are conversation starters. A bank with 8% fee income as a share of total revenue is not automatically a problem, but it is a bank that needs to demonstrate, explicitly, that it has modeled what happens to ROA if net interest margin compresses 30–50 basis points.
The ROA connection is direct. Community banks with diversified fee income (noninterest income above 0.60% of assets) tend to run ROA of 1.05–1.20% more consistently across rate cycles. Banks running below 0.30% in fee income show more ROA volatility. That variance shows up in peer comparisons and, eventually, in examiner conversations.
What Do Examiners Focus On?
Examiners are not looking for a specific noninterest income target. They are looking for a few things:
Revenue concentration. If a single fee category (particularly overdraft income) represents a disproportionate share of total noninterest income, examiners want to see that management understands the regulatory and behavioral risk and has a contingency plan. The CFPB’s longstanding focus on overdraft practices has not disappeared. Banks that are still running 0.25%+ of average assets in overdraft fees need to be able to show that number in context and explain the trend.
Consistency between strategy and reality. If a bank’s strategic plan shows a path to higher fee income but the trend has been flat or declining for six quarters, that gap generates questions. Examiners read the UBPR peer tables and they can see when a bank is underperforming its peer group on fee generation.
Earnings quality in stress. In exam discussions around earnings and capital adequacy, examiners will ask which fee lines are durable and which are cyclical. Mortgage banking income does not count as a reliable earnings offset in a stress scenario. Trust and wealth fees largely do.
Compliance and fair lending overlap. Service charge practices, particularly fee reversal patterns and overdraft opt-in processes, are examined for compliance as much as profitability. A bank generating significant overdraft income should expect those practices to be reviewed in detail in a compliance exam.
Reading Schedule RI: Where the Numbers Live
Noninterest income is on Schedule RI of the call report, lines 5.a through 5.l, with a total at 5.m. The major subcategories (service charges, trust fees, mortgage banking, cards) are separately reported and flow directly into peer comparison tables in the UBPR (Page 3, “Noninterest Income, Expenses and Yields”), both governed by the reporting standards set per the FFIEC.
The UBPR presents these as a percentage of average assets and benchmarks them against the bank’s peer group. That peer group comparison is the starting point for any board-level discussion. Is the bank above or below peer on total fee income? Which specific categories are driving the gap? Has the trend been improving or eroding over the past six to eight quarters?
BankRegReports surfaces this data for every FDIC-insured institution going back 25 years (total noninterest income, each Schedule RI subcategory, the fee income ratio, and peer benchmarks) without requiring any data engineering.
What the Fee Mix Reveals About Your Bank
A bank’s noninterest income breakdown is a portrait of its customer relationships and its strategic choices over the past decade. A flat or declining fee ratio at a time when assets grew tells you the bank has not successfully converted balance-sheet growth into deeper, fee-generating relationships. A bank that grew wealth management fees 8% annually for five years while its peer group was flat made a real investment in people, systems, and client acquisition, and is now running with a more resilient revenue base.
The ALCO conversation about fee income should not be a retrospective on what last quarter’s Schedule RI showed. It should be forward-looking: which fee categories can grow even if rates stay flat for another 18 months, what would a 40-basis-point margin compression do to ROA if fee income held versus if it dropped proportionally, and where is the bank underpricing services relative to the value it delivers?
Those questions have numbers behind them. Finding those numbers starts with knowing exactly where your bank sits against peers, and why.
The data in this post is available through the BankRegReports platform. Pull peer benchmarks, Call Report metrics, UBPR trends, and enforcement history for any FDIC-insured bank. No data engineering required.