Core Bank Earnings Before Credit Costs: A Worked Analysis
Pre-provision net revenue is the metric that separates credit-cycle noise from franchise performance. This post is the worked analysis; the glossary entry carries the definition, formula and a live bank …
Pre-provision net revenue is the metric that separates credit-cycle noise from franchise performance. This post is the worked analysis; the glossary entry carries the definition, formula and a live bank example. It tells you what a bank’s core operations actually produce before management decides how much to set aside for loan losses. That distinction is worth taking seriously, because the provision is the single most volatile and discretionary item on a bank’s income statement, and it can make a fundamentally sound bank look broken, or a fundamentally broken one look fine.
In 2020, when provisions surged and PPNR held steady, the gap between the two was exactly what the metric was designed to show.
What Pre-Provision Net Revenue Actually Measures
The formula is simple:
PPNR = Net Interest Income + Noninterest Income − Noninterest Expense
That is it. Total revenue (the spread earned on assets plus fee income) minus overhead. No provision, no taxes, no extraordinary items.
On the call report (FFIEC 031/041/051), the components map directly to Schedule RI. Net interest income is the difference between interest income (RIAD4107) and interest expense (RIAD4073). Total noninterest income is RIAD4079. Noninterest expense is RIAD4093. Pull those four codes and you can compute PPNR for any of the about 4,300 FDIC-insured banks filing today. For holding companies, the same logic applies to Schedule HI on the FR Y-9C.
What PPNR excludes, the provision for credit losses (RIADJJ33, Schedule RI item 4), is the number that generates most of the confusion in bank earnings coverage.
The Provision Problem
Under CECL (ASC 326, adopted by most banks in 2020–2023), banks recognize lifetime expected credit losses the moment a loan is originated, not when it goes bad. That front-loads provisioning in a way that can look alarming on the income statement even when the loan book is performing fine. Add in the fact that reserve releases in benign environments can artificially inflate reported earnings, and you have a line item that tells you a great deal about management’s macro outlook and accounting judgment, but relatively little about the operational health of the bank that quarter.
PPNR sidesteps that entirely. A bank with $17 million of PPNR generates $17 million of pre-credit-cost earnings from its core operations, full stop. Whether the provision is $2 million or $12 million is a separate question about the credit cycle and loss expectations. Mixing the two obscures both.
A Worked Example
| Line Item | Amount |
|---|---|
| Net interest income (RIAD4107 − RIAD4073) | $34 million |
| Noninterest income (RIAD4079) | $9 million |
| Total revenue | $43 million |
| Noninterest expense (RIAD4093) | $26 million |
| Pre-provision net revenue (PPNR) | $17 million |
| Provision for credit losses (RIADJJ33) | $5 million |
| Pretax income | $12 million |
In a calm credit environment, most of that $17 million flows through to pretax income. Stress the scenario (say a commercial real estate downturn pushes the provision to $14 million) and pretax income collapses to $3 million, but PPNR has not moved. The franchise still generates $17 million per quarter. That is the cushion regulators and analysts actually want to know about.
PPNR in Stress Testing
This is where the metric earns its keep in regulatory practice. In DFAST and CCAR, the Fed’s supervisory scenarios model two things separately and then combine them: how much the bank earns through the stress horizon (PPNR) and how much it loses (net charge-offs, provisions). The difference, net of taxes, flows into or out of capital.
A bank with strong PPNR relative to its risk-weighted assets has a natural earnings buffer. It can absorb a heavy provision for several quarters and still avoid a capital breach. A bank with thin PPNR has almost no buffer; losses pass through to capital almost immediately. That asymmetry is exactly what the stress test is designed to expose, and it is why examiners and bank CFOs track PPNR as carefully as they track the CET1 ratio.
The bank stress testing literature sometimes calls PPNR the “first line of defense” against credit losses. That framing is accurate. Capital is the last line; earnings, specifically pre-provision earnings, is what you lean on first.
How to Use PPNR in Practice
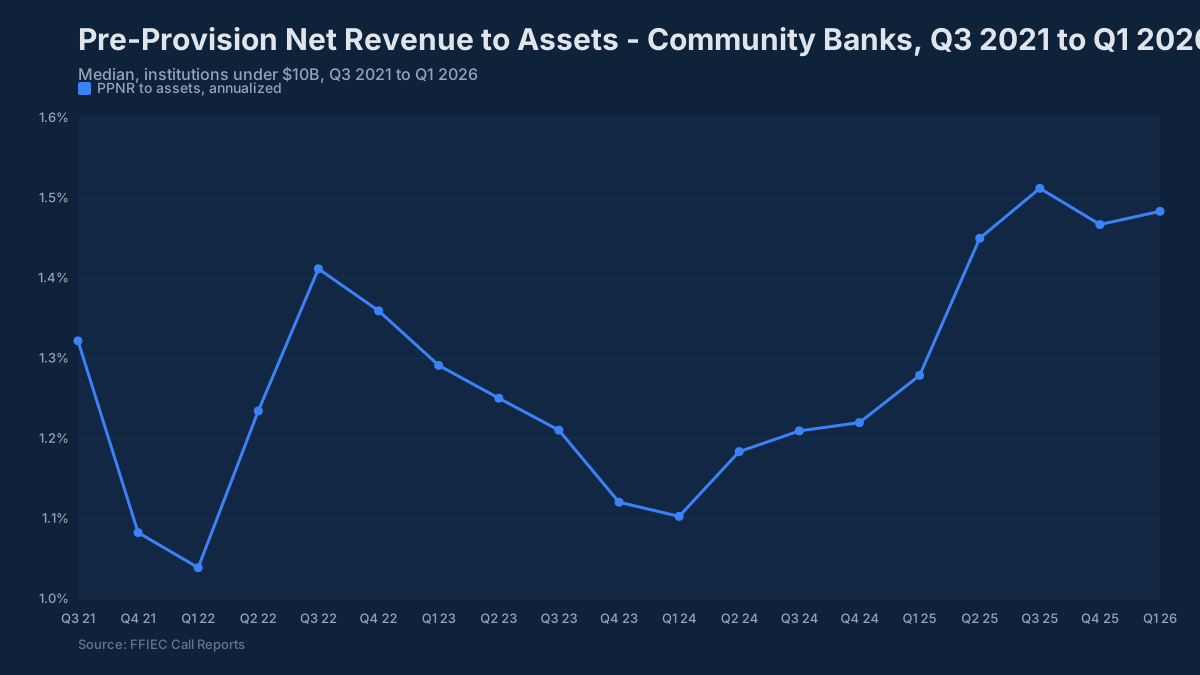
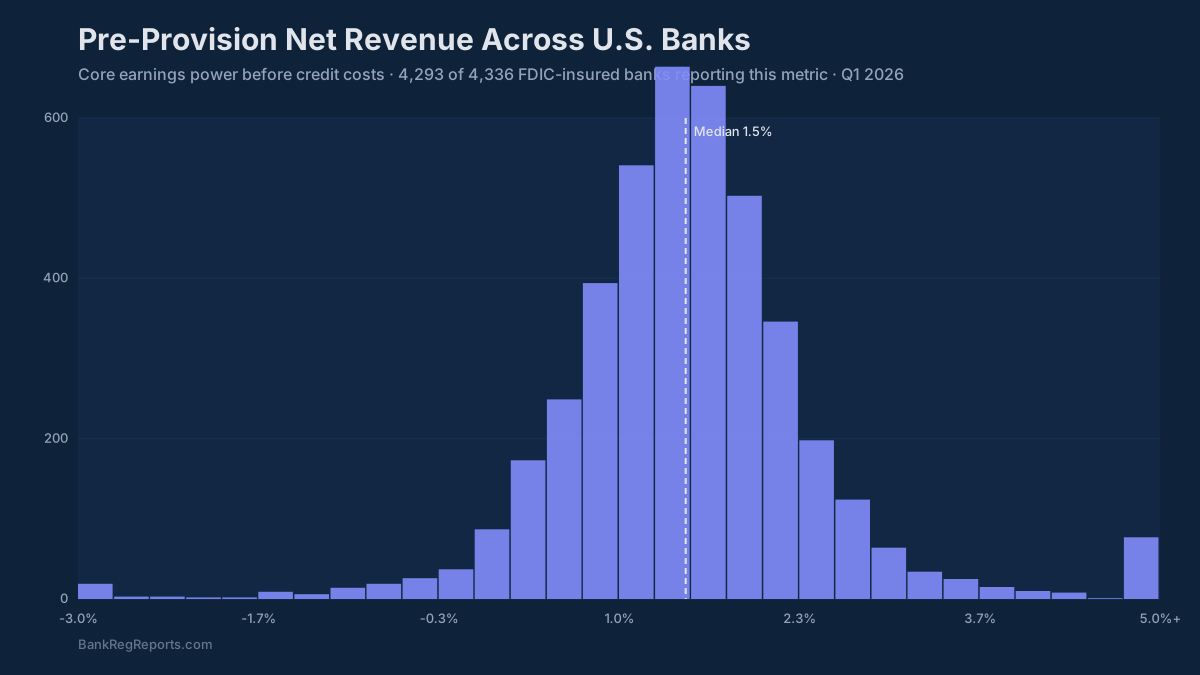
PPNR ROA is the most useful scaling. Raw dollar PPNR is hard to compare across banks of different sizes. Annualized PPNR divided by average assets, call it PPNR ROA, puts everyone on the same footing. For community banks it has recently run around 1.4%–1.7%: the FDIC put community bank pretax ROA at 1.35% for Q4 2025 and 1.32% for full-year 2025, and adding back provisions lifts that only modestly. A bank consistently below 1.2% is generating thin earnings to absorb any credit stress. A bank running above 2.5% either has an unusually efficient operation or is taking risk somewhere that has not shown up in losses yet.
Decompose before concluding. PPNR changes because revenue went up or down, or because expenses went up or down, or both. A $2 million PPNR improvement driven by a 15 basis point net interest margin expansion is a different story than the same improvement driven by cutting the loan origination team. The efficiency ratio (noninterest expense divided by revenue) sits inside the PPNR calculation and tells you which side is moving.
Watch it alongside the provision, not instead of it. Stable PPNR with a rising provision tells you the credit environment is getting harder but the franchise is holding. Declining PPNR with a stable provision tells you the underlying business is weakening regardless of credit conditions. The two metrics answer different questions; you need both.
Quarter-to-quarter volatility is normal; trend matters. Noninterest income in particular can swing from securities gains, MSR valuations, or one-time items. Look at trailing four-quarter PPNR to get a cleaner read on the underlying run rate.
Frequently Asked Questions
What is pre-provision net revenue (PPNR)? Pre-provision net revenue is a bank’s net interest income plus noninterest income, minus noninterest expense, before the provision for credit losses and taxes. It measures what the bank’s core operations earn independent of credit-cost decisions.
How is PPNR calculated? PPNR = Net Interest Income + Noninterest Income − Noninterest Expense. On the FFIEC 031/041/051 call report, the inputs are Schedule RI items RIAD4107, RIAD4073, RIAD4079, and RIAD4093. The provision (RIADJJ33) is excluded.
Why exclude the provision for credit losses? The provision is the most volatile and management-discretionary item on the income statement, swinging with both economic outlook and CECL model assumptions. Stripping it out reveals the earning power that exists regardless of where reserve levels sit.
Why does PPNR matter for stress testing? PPNR is the earnings buffer a bank deploys against credit losses before they hit capital. Regulators model it separately from loss rates in DFAST/CCAR precisely because the interaction between pre-provision earnings and net charge-offs determines whether a bank’s capital survives the stress scenario.
What is the difference between PPNR and net income? Net income is after the provision, taxes, and all other below-the-line items. PPNR is above all of that. In a normal quarter the gap is mostly provision and taxes; in a stress quarter, the provision component can dwarf taxes and make the two numbers look nothing alike.
Where can I find a bank’s PPNR? Schedule RI of the quarterly call report contains all four inputs. BankRegReports computes PPNR and PPNR ROA for every FFIEC filer and benchmarks them against configurable peer groups, with history going back to 2001.
BankRegReports publishes call report, UBPR, FDIC, Federal Reserve, NCUA, and SEC EDGAR data for every U.S. bank and credit union, with peer benchmarks and quarterly history. Look up a bank