How to Read a Bank Balance Sheet (Schedule RC)
At the end of 2022, the banking industry's aggregate AOCI balance swung to negative $326 billion, about -14.7% of total reported equity, after touching -16.0% in the third quarter, the …
At the end of 2022, the banking industry’s aggregate AOCI balance swung to negative $326 billion, about -14.7% of total reported equity, after touching -16.0% in the third quarter, the largest unrealized-loss drag in the modern call report record. Most of the banks showing that number had done nothing wrong in a credit sense. They had bought Treasuries and agency MBS at low rates, classified them as available-for-sale, and watched the mark-to-market flow straight through to book equity as the Fed hiked. The bank balance sheet captured all of it in real time, quarter by quarter, in Schedule RC. If you know how to read that schedule, you saw the problem building for a year before SVB became a headline.
That is what reading a bank balance sheet actually means in practice: not memorizing accounting definitions, but knowing which lines carry signal, which ratios examiners track, and what a number that looks fine in isolation looks like when compared against the roughly 4,300 other banks filing the same report.
Schedule RC: The Balance Sheet Filed by Every FDIC-Insured Bank
Every FDIC-insured commercial bank and savings institution files Schedule RC quarterly as part of the FFIEC 031 (banks with foreign offices) or FFIEC 041/051 (domestic-only) call report. The format is standardized across all filers, which is what makes the data so analytically powerful: a $300M community bank in rural Georgia and a $9B regional in Phoenix are reporting against the same line items, the same MDRM codes, the same definitions.
The accounting identity governing every line is:
Assets = Liabilities + Equity
A bank’s assets are funded by either money it owes back to others (primarily deposits) or by its owners’ capital. Deposits showing up as liabilities is not a quirk; it is the core of the business model. The bank borrows from depositors, lends that money at a higher rate, and pockets the spread. Schedule RC lays both sides of that trade out in full.
For well-capitalized community banks, equity typically runs 9–11% of total assets. That thin cushion is deliberate. Leverage is how a bank earning 1.0–1.1% on assets (the typical ROA range) generates returns on equity in the 10–13% range that investors expect. It also means a 3% decline in asset values can consume roughly a third of equity in a single quarter, which is why regulators care about balance sheet composition far more than they care about any single income metric.
 ratio across every FDIC-insured U.S. bank](/static/blog/figures/distribution_tce-2026q1.svg)
The Asset Side: What the Bank Owns and What It Earns
Bank assets run from most liquid to least. Working down the schedule:
Cash and balances due from depository institutions (RCON0081 + RCON0071): vault cash, reserve balances at the Fed, and amounts due from correspondent banks. These earn nothing or near nothing, but they are the first line of liquidity defense. A bank running unusually low cash balances relative to peers is either highly efficient at deploying capital or is managing closer to the edge on liquidity than its examiners may prefer.
One note on prefixes before you pull anything. The same call report item carries a different prefix depending on which form the bank files. FFIEC 041 and 051 filers report RCON, for domestic offices. FFIEC 031 filers report RCFD on a consolidated basis, and RCFN for foreign offices, so total deposits for an 031 filer is RCON2200 plus RCFN2200 rather than RCON2200 alone. Schedule RC-R Part I (regulatory capital and the capital ratios) moved off RCON with the Basel III revisions of 2014 and 2015 and now uses RCOA on the 041 and 051 and RCFA on the 031; Part II (risk-weighted assets) still reports under RCON and RCFD. Query a single prefix and you will silently drop a whole population rather than get an error, and for an RCON-only query that population is the largest banks in the country.
Securities split into available-for-sale (AFS, marked to fair value with the unrealized gain/loss flowing through AOCI) and held-to-maturity (HTM, carried at amortized cost). The AFS/HTM classification decision became consequential in 2022–2023. Banks that shifted portfolios from AFS to HTM avoided the equity hit from rising-rate marks, but the transfers locked in the book-value accounting at the cost of liquidity flexibility. Examiners noticed, and asked banks to explain the transfer rationale. The securities book tells you how a bank is positioned for rate changes and what it is using as its secondary liquidity reserve.
Loans and leases are typically 60–75% of assets for a lending-focused community bank and the primary driver of both net interest income and credit risk. RCON2122 is total loans and leases (net of unearned income, before the allowance); RCON3123 is the allowance. On Schedule RC, loans held for investment are RCONB528 (item 4.b), the allowance is RCON3123 (item 4.c), and net loans are RCONB529 (item 4.d). RCON2122 is the Schedule RC-C total, which also includes loans held for sale. The loan mix matters enormously: under longstanding interagency guidance, total CRE at 300% or more of total risk-based capital with 50% growth over 36 months, or construction loans at 100% or more, draws closer supervisory scrutiny, and banks that meet those screens get asked for stronger concentration management policies. The detailed breakdown by loan type, repricing, and maturity lives in Schedule RC-C.
Premises and fixed assets (RCON2145) are non-earning. An outsized premises number (say, above 3–4% of assets) sometimes flags an overcapitalized branch network or aging infrastructure. It rarely swings performance materially, but it absorbs capital that could otherwise be deployed into earning assets.
Goodwill and other intangibles (RCON3163 and RCONJF76, Schedule RC-M items 2.b and 2.c; the total rolls up to Schedule RC item 10) are acquired in mergers. They are non-earning and excluded from tangible capital calculations. A bank carrying goodwill equal to 40–50% of its reported equity has a meaningfully weaker tangible capital cushion than any headline leverage ratio implies. Always strip them out before drawing conclusions about capital adequacy at acquisition-active banks.
The Liability Side: How the Bank Is Funded and at What Cost
Funding quality matters as much as funding cost. A bank that has assembled $800M in deposits entirely from rate-sensitive internet accounts and jumbo CDs looks very different from one with $800M in local operating accounts and long-tenured savings relationships, even at the same total and same weighted average rate.
Deposits (RCON2200 total) are the dominant liability for virtually every community bank, typically 75–90% of total funding. The analytical split that matters is core versus non-core. Core deposits (checking, savings, money market accounts below the insurance limit, and small time deposits) tend to be relationship-based, slower to reprice, and sticky under stress. Non-core funding (brokered deposits, jumbo CDs, internet-rate certificates, reciprocal deposits above a certain threshold) reprices immediately, can exit quickly, and historically concentrates during liquidity stress events. A bank funded 20–25% by brokered deposits faces very different ALCO decisions than one funded entirely by local households and small businesses.
Federal funds purchased and securities sold under agreements to repurchase (RCONB993 + RCONB995, Schedule RC items 14.a and 14.b) represent short-term wholesale borrowing. Volatile, rate-sensitive, and renewal-dependent. A bank that chronically relies on overnight Fed funds purchased to fund term loans is running a structural asset-liability mismatch that most examiners will flag in a Matter Requiring Attention.
FHLB advances and other borrowings. Federal Home Loan Bank advances can be fixed-rate and term-structured, which makes them more defensible as a funding match for longer-duration assets than overnight borrowing. But they remain wholesale funding, and supervisors treat wholesale-dependent institutions more skeptically during liquidity reviews. The UBPR net non-core funding dependence ratio, non-core liabilities less short-term investments divided by long-term assets, summarizes the exposure. The median community bank ran about 27% at March 31, 2026; readings well above that, especially when rising, attract attention.
Subordinated debt counts as Tier 2 capital under Basel III. Some community banks issue sub-debt specifically to boost total capital ratios without diluting common equity holders. It counts in the regulatory buffer but does not protect depositors the same way common equity does.
Equity: The Buffer Between Solvency and Failure
Bank equity has three components that deserve separate attention.
Retained earnings (RCON3632) are accumulated profits left in the bank rather than paid as dividends or used for buybacks. This is the most organic form of capital growth. A bank earning 1.0% ROA and paying out 40% of earnings is building retained earnings at roughly 0.6% of assets per year, enough to keep pace with modest asset growth without external capital raises.
AOCI (RCONB530, Schedule RC item 26.b) is where unrealized gains and losses on AFS securities land. Through most of the 2010s, this line barely moved. Then the 2022–2023 rate cycle pushed industry aggregate AOCI to -16.0% of total equity at the Q3 2022 trough, ending 2022 at -14.7%, a figure that has only partially recovered as rates have stabilized. For most community banks, AOCI is excluded from regulatory capital ratios via the opt-out election under Basel III. But it flows directly into reported book equity and tangible book value per share, which matters for M&A pricing, secondary stock offerings, and analyst coverage.
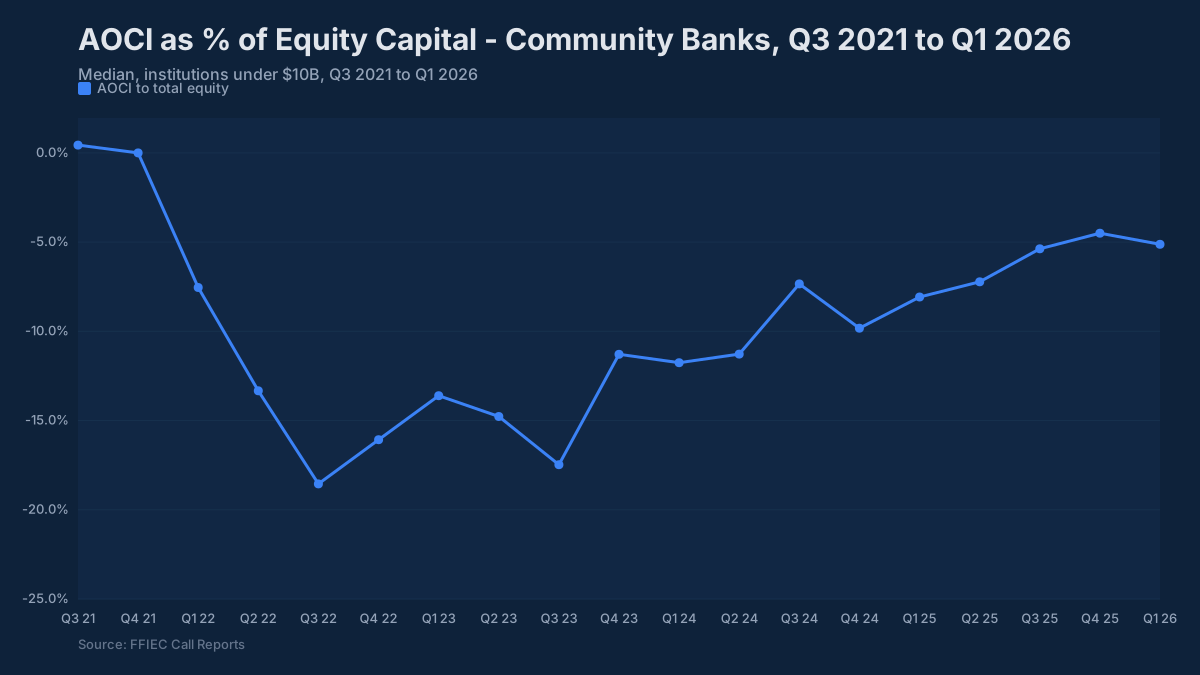
Goodwill and intangibles reduce tangible common equity dollar for dollar. A bank with $100M in reported equity and $25M of goodwill has $75M in tangible capital. Always make this adjustment when comparing capital strength across banks with different acquisition histories.
The Ratios That Actually Drive Examiner Focus
A balance sheet is best read as a set of structural relationships, not a column of figures.
Loans-to-assets measures lending intensity. Above about 75–80%, the bank is an aggressive lender with a thin securities buffer and limited liquidity flexibility (the median bank ran about 68% at March 31, 2026). Below 45%, the bank either cannot find quality loan demand or has made a deliberate strategic choice to run a more liquid, lower-yielding book.
Loan-to-deposit ratio is a funding efficiency test. The median community bank runs about 80%. North of 90–100%, the bank is funding some portion of its loan book with wholesale borrowings or other non-deposit sources. That is not automatically a problem, but it changes the liquidity risk profile significantly.
Equity-to-assets (leverage ratio) gives you the baseline capital cushion. The prompt corrective action well-capitalized threshold for the leverage ratio (Tier 1 capital over average total assets, a close cousin of simple equity-to-assets) is 5% for every insured bank, but community banks well below the DFAST threshold typically run 8–11%. Anything below 7% warrants close reading of the capital plan and retained earnings trajectory.
AFS securities as a multiple of equity tells you the AOCI exposure. A bank with $400M in AFS and $80M in equity has a five-to-one ratio. A 10% mark-to-market decline in that portfolio (realistic in a 150-basis-point rate move) eliminates half of reported equity. That bank’s board needs to understand the scenario, even if the regulatory capital ratio is unaffected by the opt-out election.
Tangible common equity (TCE) ratio, total equity minus goodwill and intangibles, divided by tangible assets, is the bluntest measure of loss-absorbing capacity. Strong community banks run TCE above 8%. Below 6% deserves a conversation about capital preservation.
A Simplified Balance Sheet in Practice
| Amount | % of assets | |
|---|---|---|
| Assets | ||
| Cash & balances due | $90M | 9% |
| Securities (AFS + HTM) | $230M | 23% |
| Loans & leases, net | $620M | 62% |
| Premises, goodwill, other | $60M | 6% |
| Total assets | $1,000M | 100% |
| Liabilities & equity | ||
| Deposits | $830M | 83% |
| Borrowings & other liabilities | $70M | 7% |
| Total equity | $100M | 10% |
| Total liabilities + equity | $1,000M | 100% |
The 62% loans-to-assets puts this bank in the typical mid-range for a lending-focused community bank. The 83% deposit-funded structure is solid, better than a bank relying on 15–20% wholesale funding. The 10% equity ratio is adequate on its face. But if $20M of that equity is goodwill from an acquisition, the tangible leverage ratio is closer to 8%, and the AFS portfolio composition determines whether that cushion is stable or rate-sensitive.
Frequently Asked Questions
What is a bank balance sheet? A snapshot of what a bank owns (assets), what it owes (liabilities), and owners’ capital (equity) at a point in time. Filed quarterly as Schedule RC in the call report. Deposits are liabilities; loans are assets.
Why are deposits liabilities on a bank balance sheet? Deposits belong to customers, not the bank. The bank owes them back on demand or at maturity. They are the bank’s primary funding source, borrowed money deployed into earning assets.
What are the main assets on a bank balance sheet? Loans and leases are typically the largest category (about two-thirds of assets), followed by securities (AFS and HTM), cash and Fed reserve balances, and smaller items like premises and intangibles.
What is Schedule RC? The balance sheet section of the quarterly call report, filed on FFIEC 031 or FFIEC 041/051. It reports assets, liabilities, and equity in a standardized format across all FDIC-insured institutions, making peer comparison direct and consistent.
How much equity does a community bank typically carry? Usually 9–11% of total assets. The CET1 median for community banks runs around 14.5% on a risk-weighted basis. The leverage amplifies returns but also means a 3–4% decline in asset values can consume a significant share of capital, which is the reason regulators set minimums and monitor the ratio quarterly.
Where can I see a bank’s balance sheet? Schedule RC in the call report is the primary source. The UBPR converts it into peer-comparable ratios. BankRegReports displays balance sheet composition, AOCI trends, loan concentration ratios, and peer benchmarks for every U.S. bank, updated each quarter after the FFIEC filing window closes.
The data in this post is available through the BankRegReports platform. Pull peer benchmarks, Call Report metrics, UBPR trends, and enforcement history for any FDIC-insured bank. No data engineering required.