De Novo Banks: How to Analyze a Bank With No Track Record
From 2010 through 2017, new bank charters in the United States nearly stopped: only about 30 opened in eight years, and just 15 after 2010. In a typical pre-crisis year, …
From 2010 through 2017, new bank charters in the United States nearly stopped: only about 30 opened in eight years, and just 15 after 2010. In a typical pre-crisis year, regulators approved 100 to 200. That eight-year near-freeze reshaped who even knows how to build a bank anymore, and it explains why de novo banks are so poorly understood by most analysts who encounter one.
A de novo bank is a newly chartered institution created from scratch. No acquired branch network, no legacy loan book, no years of UBPR trends to anchor your analysis. Just a charter, an initial capital raise, and a business plan that regulators found credible enough to approve. The FDIC uses the term specifically to distinguish these startups from institutions formed through acquisition or reorganization. The Latin etymology, “anew,” is apt. Everything has to be built.
Right now, roughly 4,300 FDIC-insured institutions file quarterly Call Reports. De novos are a small fraction, but they show up: in your loan portfolio, your peer group, your community, your deal pipeline. Knowing how to read a thin file is a real skill, and the standard ratios will mislead you if you apply them without adjustment.
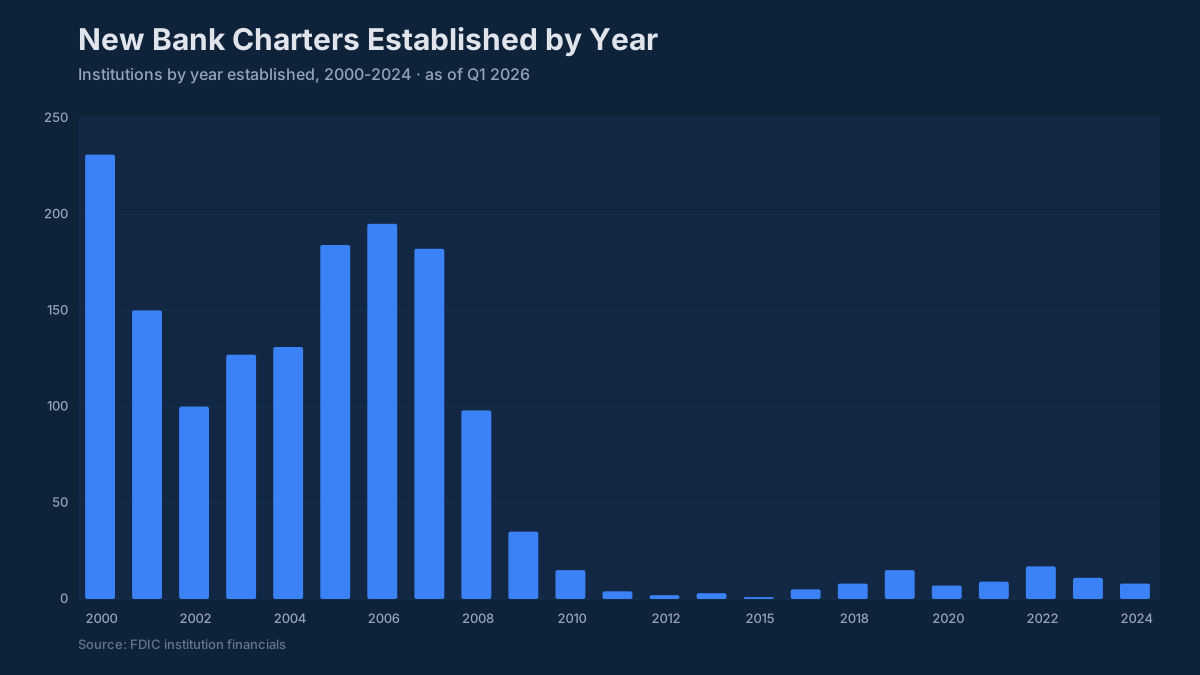
That near-decade of almost no activity is not just historical trivia. The cohort of bankers who know how to build an institution from scratch has grayed considerably. Many of the organizing groups filing today are doing so without institutional memory of what the process actually looks like.
How a New Bank Charter Gets Approved
The process is long and deliberately expensive to initiate. Founders, typically called the organizing group, assemble a management team and board, then develop a business plan that regulators will scrutinize line by line: target markets, product mix, projected balance sheet, staffing, technology, and a credible timeline to profitability. They also have to raise capital before opening a single account, because a de novo cannot draw on retained earnings it does not have.
For a national charter, the application goes to the OCC. State charters go to the relevant state banking department. Either way, a separate FDIC application for deposit insurance runs concurrently; without deposit insurance, no depositor with any sense will show up, and the bank cannot function as an insured institution.
The bar is high because regulators know the data: de novos fail at materially higher rates than established banks, particularly in years two through five. A weak management team or an optimistic loan growth assumption that falls apart in year three is a problem for the insurance fund. The review process reflects that exposure.
State charter applications sometimes move faster, and regulatory philosophy varies: some state regulators have been more receptive to fintech-adjacent or narrow-purpose applications. But the FDIC deposit insurance review is the common chokepoint regardless of chartering authority.
What the De Novo Period Actually Means
After opening, a newly chartered bank enters what regulators call the de novo period. The FDIC extended it from three to seven years in 2009 in response to crisis-era failure data, then rescinded that extension in April 2016, restoring the three-year window. During this window, the bank is subject to more frequent examinations, higher capital expectations, and restrictions on deviating from the approved business plan without prior regulatory sign-off.
That last point catches people off guard. A de novo that wants to enter a new lending market, adjust its fee structure materially, or make an acquisition has to go back to regulators first. It is less autonomous than an established bank.
The logic is direct: the charter was approved for a specific plan. Regulatory approval was not a blank check for whatever the bank decides to do in year two.
Capital expectations during the de novo period run above the standard minimums. Regulators typically require a Tier 1 leverage ratio well above the 4% floor that applies to established institutions (the FDIC conditions deposit insurance on at least 8% during the de novo period) because early operating losses will compress capital faster than any ratio trend can warn you about. An established community bank carries a CET1 ratio around 14.5% (the median among banks that report it). A de novo enters with a leverage ratio that can exceed 30% at opening, then watches it fall every quarter as the balance sheet grows and losses accumulate.
The Real Risk Factors
Every credit training program says de novos are risky. Here is what that looks like in the numbers.
Capital burn is the central story. A de novo runs pre-provision losses for months or years while it builds scale. The burn rate against initial capital, tracked as RCON3210 (total equity capital) quarter over quarter relative to total assets, is the single most predictive early indicator. If equity is eroding faster than the business plan projected, that is not a variance to explain; it is the central question of the analysis.
The loan book looks clean because it is new. A loan originated six months ago has not had time to go bad. Schedule RC-N (past due and nonaccrual) on a de novo’s Call Report will look pristine in year one almost regardless of underwriting quality. Compare that to a mature community bank, where an NPL ratio of about 0.5% is typical and anything above 2.0% raises examiner concern. On a de novo, a 0.00% NPL ratio carries no information about credit quality. What matters is the loan composition, documentation standards, and whether growth is being driven by rate concessions: data points that appear in Schedule RC-C and in the examiner’s comments, not in an NPL ratio at month nine.
Rapid growth is necessary but not inherently safe. A de novo must grow to cover its fixed costs. That pressure is real and rational. But concentrated growth in CRE or construction is where de novos historically accumulate problems. The 2006 interagency guidance flags total CRE at 300% of total risk-based capital combined with 50% growth over 36 months, a screen for supervisory attention rather than a limit, and a fast-growing de novo can meet both conditions quickly when CRE is the only available volume. Track RC-C Part I loan composition every quarter, and watch the mix as the bank builds.
Management track record substitutes for institutional history. The bank has no operating history. The team does. A CEO who ran a profitable community bank through 2008–2010 is a categorically different risk profile from a banker who has only operated in a stable rate environment. That qualitative judgment has to carry more weight than it would for an institution with fifteen years of UBPR trend data.
Deposit concentration is an early warning system. New banks frequently open with significant funding from a small number of large depositors: organizers, local businesses, board members. A deposit base that is 30% concentrated in ten relationships is fragile in ways that will not show in a standard loan-to-deposit ratio analysis. The median established community bank runs an LTD ratio of about 80%. A de novo may show 50% with assets growing fast. That is not evidence of a healthy funding buffer; it may reflect a funding base that has not been stress-tested at all.
Reading the File When the File Is Thin
A de novo files its first Call Report (usually the FFIEC 051 for a small domestic bank, otherwise the 041 or 031) in the quarter it opens. BankRegReports ingests that filing as it arrives, which means you can track the trajectory from quarter one against a clean data set.
The UBPR is less useful here than for established banks. The peer ratios are anchored to institutions with years of operating history, so the comparisons mislead. A de novo’s ROA of -1.8% in year one looks alarming against a community bank peer median of about 1.15%, but it is not evidence of mismanagement; it is expected arithmetic. Similarly, an efficiency ratio above 100% in the early quarters (more expense than revenue) is the norm, not an alarm. The industry benchmark of 60–65% for established banks is simply not applicable.
The more productive approach is building a quarterly trajectory model focused on four questions: Is the equity capital burn rate decelerating? Are operating losses narrowing? Is deposit growth keeping pace with loan growth? And is the loan portfolio diversifying or concentrating?
A quarterly pull of those four measures tells a story numbers-first. Capital declining each quarter as losses accumulate. Assets growing fast, perhaps faster than the plan anticipated. Leverage ratio compressing steadily. The question every de novo analyst has to answer is whether losses reach zero before the leverage ratio hits the regulatory floor. That is the whole game in years one through three.
What Examiners Focus On
Examiners entering a de novo are not running their standard ratio screen. They know the early-period numbers look unusual. What they are looking at:
Business plan adherence. If the approved plan projected $120M in assets at year two and the bank is at $195M, that is a material deviation, not a success story. Examiners will ask whether the growth was in the approved loan types and whether underwriting standards held as volume increased.
Capital adequacy with forward-looking stress. A leverage ratio of 9% sounds adequate until you run eighteen months of projected losses against it. Examiners will pressure-test the capital trajectory, not just the current ratio. A bank with $18M in equity and $200K in quarterly losses has a very different capital profile than a bank burning $600K per quarter.
Management depth. Can the CFO explain the variance between projected and actual NIM? Does the credit officer understand the concentration trends in the loan portfolio? These are judgment calls that examiners weight heavily when the institution has no track record to point to.
Board engagement. A de novo board that is not reading quarterly financials critically, that is rubber-stamping management’s optimistic projections, is itself a supervisory concern. Examiners expect the board to understand the burn rate and to be asking the same trajectory questions an outside analyst would ask.
Frequently Asked Questions
What is a de novo bank? A de novo bank is a newly chartered institution created from scratch, not formed through an acquisition or reorganization of an existing bank. It has just received its charter and FDIC deposit insurance and has little or no operating history.
How is a new bank charter formed? Founders assemble a management team and a detailed business plan, raise start-up capital, apply for a charter through the OCC (national) or a state banking regulator, and file separately with the FDIC for deposit insurance. Both approvals are required. The review evaluates management experience, the realism of financial projections, and initial capital adequacy.
What is the de novo period? The de novo period is the early supervisory window, three years under current FDIC policy after the agency rescinded its 2009 seven-year extension in 2016, during which the bank is examined more frequently, held to higher capital standards, and restricted from making material changes to its approved business plan without prior regulatory approval.
Why do de novo banks fail at higher rates? They have no earnings cushion and must survive on start-up capital through early operating losses. Their loan portfolios are unseasoned, so credit problems may not appear for a year or more. They face pressure to grow rapidly to reach breakeven, which drives concentration risk. And they are operationally unproven across every function simultaneously.
How do you analyze a bank with only a few quarters of history? Peer ratio comparisons are a weak primary tool; the peer group has years of operating history that a de novo does not. Build a quarterly trajectory model instead: equity capital burn rate, whether operating losses are narrowing, deposit growth velocity, and loan composition from Schedule RC-C. The direction of each metric matters more than its level.
Where can I find a de novo bank’s financials? A de novo files the same quarterly Call Report as every FDIC-insured institution from its first quarter of operation. Those filings are public. BankRegReports captures each new bank’s filings as they arrive and tracks the early trajectory with full FFIEC source data.
One thing the charter approval data does not tell you: how many organizing groups withdrew before filing, or filed and gave up during the review. The visible count understates actual demand by a meaningful margin. As rates stabilize and the regulatory posture at the federal level continues to shift, de novo activity may accelerate, which means the analysts who know how to read a thin file will have real work ahead of them.
The data in this post is available through the BankRegReports platform. Pull peer benchmarks, Call Report metrics, UBPR trends, and enforcement history for any FDIC-insured bank. No data engineering required.