Net Non-Core Funding Dependence: What It Measures and Why It Matters
Silicon Valley Bank's net non-core funding dependence ratio climbed for six consecutive quarters before March 2023. The number was sitting in its UBPR the entire time. That ratio exists precisely …
Silicon Valley Bank’s net non-core funding dependence ratio climbed for six consecutive quarters before March 2023. The number was sitting in its UBPR the entire time. That ratio exists precisely to flag structural fragility before it becomes a headline, and it answered a question nobody was asking loudly enough: how much of this bank’s long-term lending is propped up by money that can leave in 48 hours?
For ALCO members, treasury officers, and credit officers benchmarking peers, net non-core funding dependence is one of the most direct reads on funding risk available from public call report data. It does not require a model or proprietary data source. It is in the UBPR every quarter, for every FDIC-insured institution.
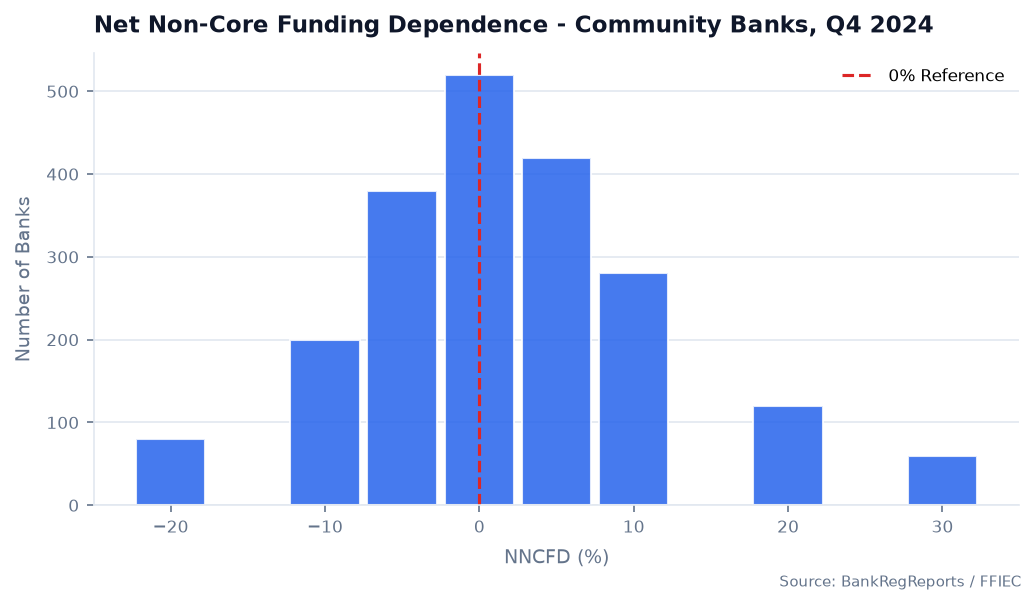
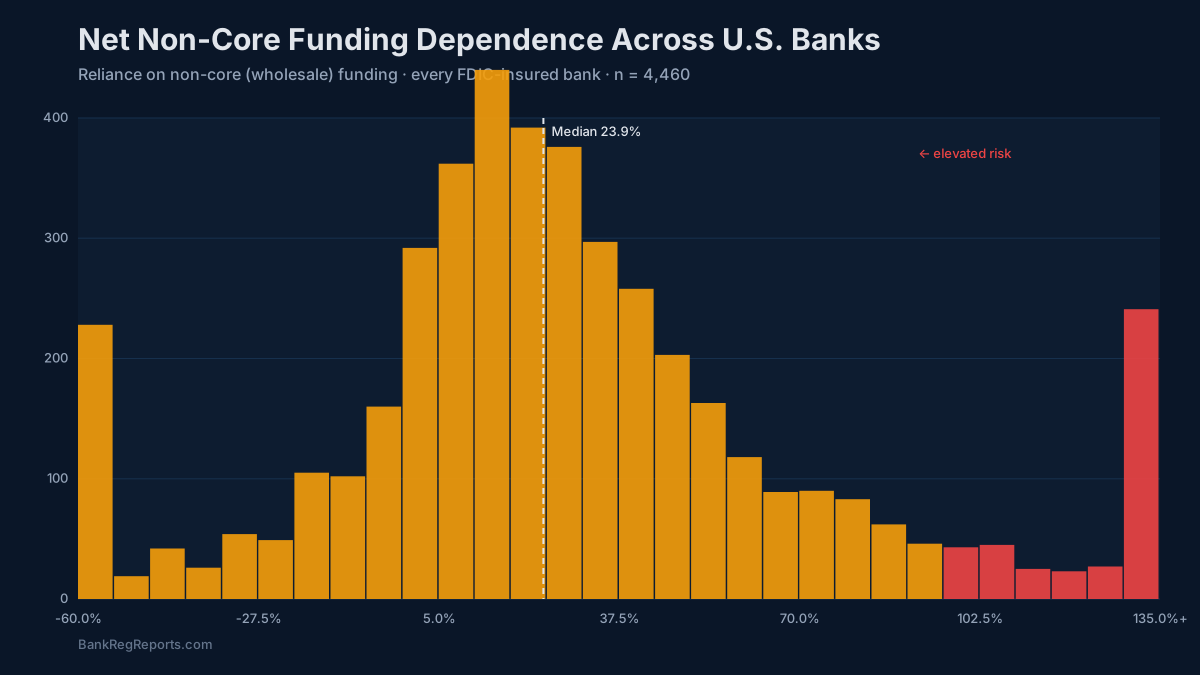
The shape of that distribution matters for peer comparison. A few hundred institutions sit in the high tail. That is where the examination conversations get uncomfortable.
Core Versus Non-Core: The Distinction That Drives the Ratio
Every bank funds its assets from two buckets that do not behave the same way under stress.
Core funding is relationship money — demand deposits, NOW accounts, savings accounts, and smaller consumer time deposits. Customers hold these accounts because of the banking relationship, not because a rate aggregator pointed them to the highest yield. When rates move, core depositors are slow to react. When confidence wobbles, most of them stay. This is the funding base a bank can actually plan around.
Non-core funding is rate-sensitive and transactional: brokered deposits placed by third-party intermediaries, large time deposits above the $250,000 insurance threshold, Federal Home Loan Bank advances, fed funds purchased, and other wholesale borrowings. You can raise it fast, which is precisely what makes it dangerous. Wholesale money flows to the best rate or the safest balance sheet. When a bank’s story changes — a bad earnings release, a rating action, a social-media rumor — non-core funding can reprice or exit in days, not quarters.
FHLB advances deserve specific attention. Banks posted record FHLB borrowings in 2022 and 2023 to fill gaps left by deposit outflows during the rate-shock cycle. Those advances appear directly in the non-core funding numerator. A bank that has been growing FHLB reliance while losing core deposits is building exactly the structural dependency this ratio is designed to catch.
How the Calculation Works
The UBPR defines net non-core funding dependence as:
(Non-Core Liabilities − Short-Term Investments) ÷ Long-Term Assets
Non-core liabilities are drawn from Schedule RC-E of the call report (FFIEC 031/041/051) and include brokered deposits (RCON2365), large time deposits above the insurance threshold, FHLB advances, and other wholesale borrowings. Short-term investments — money market securities, short-term Treasuries, and similar liquid instruments — are netted from the numerator because they provide a real offset: if the non-core funding disappeared tomorrow, the bank could liquidate those holdings first without taking credit losses.
Long-term assets in the denominator are the earning assets that cannot be quickly converted to cash without realizing losses: the loan portfolio and longer-dated investment securities. That is the exposure being funded.
When the ratio is negative, core funding more than covers long-term assets — the bank has excess stable funding relative to its illiquid book. When it is positive, some portion of the long-term portfolio is being funded by money with a shorter fuse. The higher the positive reading, the bigger that mismatch.
One practical difficulty: FHLB advance maturity bucketing is buried in Schedule RC-M, and brokered deposit detail requires digging through Schedule RC-E footnotes on the FFIEC 031. The UBPR assembles this into a single clean ratio, which is its main advantage over manual call report assembly. BankRegReports surfaces the ratio alongside the underlying components for every institution, with trend history going back 24-plus years.
What the Trend Tells You That the Level Doesn’t
There is no regulatory bright line on this ratio. Examiners do not cite a bank for being above 25%. What they focus on is trajectory — and the question of whether management is watching it.
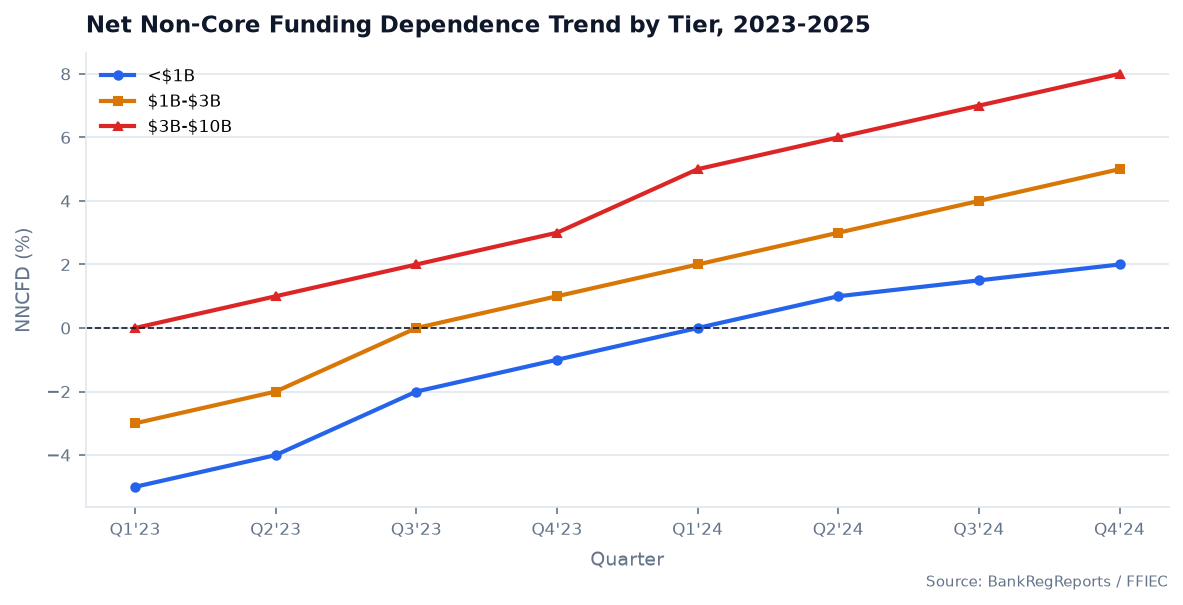
A ratio climbing from 12% to 38% over eight quarters is a different situation than a bank sitting at 38% with a stable or declining trend. The bank with the climbing ratio is actively replacing stable funding with volatile funding — probably because it is growing loans faster than it is growing deposits, or because it is losing core deposits to higher-rate competitors and filling the gap with wholesale money.
That trajectory compounds over time. A bank funding loan growth with FHLB advances or brokered deposits is building a balance sheet that requires continuous rollover. If market conditions tighten or the bank’s creditworthiness comes into question, that rollover becomes more expensive or stops. The bank that looked fine on a point-in-time basis — adequate capital, acceptable NPLs — runs out of options before it runs out of collateral.
Most well-run community banks with $300M to $2B in assets run net non-core funding dependence in the low-single-digit to mid-teen range. Above 25% starts generating examiner questions in the liquidity section of the Safety and Soundness exam, particularly if the bank is also running a loan-to-deposit ratio above 85%. Above 40% with a rising trend is the combination that gets classified as a matter requiring immediate attention in the liquidity management section of the ROE.
Reading It Alongside the Rest of the Balance Sheet
Net non-core funding dependence is not a standalone indicator. It needs context from adjacent metrics.
Pair it with brokered and uninsured deposit shares to understand what is driving the non-core number. A bank with heavy FHLB reliance has a different risk profile than one loaded with brokered deposits — FHLB access can be restricted if the bank’s financial condition deteriorates, but the mechanism differs from a brokered deposit run triggered by rate competition.
Pair it with unrealized losses on available-for-sale and held-to-maturity securities. This is the 2023 combination that proved catastrophic: high non-core funding dependence plus a securities portfolio carrying large unrealized losses that cannot be sold without destroying capital. A bank in that position has flighty funding and no clean path to generate cash from assets. The liquidity ratio looks manageable until it doesn’t.
Pair it with the loan-to-deposit ratio. A bank running an LTD above 80–85% is already fully deployed and will likely need wholesale funding to support further loan growth. The two ratios together tell you whether the bank is stretched on both sides of the balance sheet simultaneously.
Core deposit growth quarter-over-quarter is the offsetting positive signal. A bank with rising non-core dependence but also growing core deposits may be managing a deliberate growth phase — new market entry, acquisition integration, branch build-out. A bank with rising non-core dependence and flat or shrinking core deposits is filling a hole. Those are fundamentally different stories, and only the trend data separates them.
What Examiners Look For
In a typical CAMELS exam, net non-core funding dependence is reviewed under the Liquidity component alongside the contingency funding plan. Examiners want to see three things.
First, that management knows the number and watches it at each ALCO meeting — not as a footnote but as a first-order metric with a board-approved operating limit. Banks that cannot quickly produce the ratio’s eight-quarter trend during an exam send a signal about liquidity governance.
Second, that the bank has a realistic contingency funding plan that addresses what happens if the FHLB restricts access or the brokered deposit broker stops bidding. “We would replace it with other wholesale sources” is not an acceptable answer when wholesale access is exactly what would tighten under stress. Plans need to identify specific deposit campaigns, asset sale capacity, and secondary liquidity sources with realistic timelines.
Third, that the ratio’s trajectory is explainable. Examiners are not looking for a perfect number; they are looking for management that understands why the number moved and has a credible plan for where it goes next.
Pulling the Data
BankRegReports tracks net non-core funding dependence for every FDIC-insured institution across 24-plus years of quarterly history. You can see a bank’s trend, benchmark it against a custom peer group filtered by asset size, geography, or charter type, and read it alongside deposit composition and securities portfolio in a single view.
Analysts building this into a screening model or internal monitoring dashboard can access the underlying call report and UBPR data through the BankRegReports Data API. The endpoint reference is at https://api.bankregreports.com/api/v1/docs/. A pull for a single bank across eight quarters takes fewer than ten lines:
from bankregreports import BankReg

brr = BankReg("brr_your_api_key")

metrics = brr.bank_metrics(
    rssd_id=1234567,
    metrics=[
        "net_non_core_funding_dependence",
        "brokered_deposit_pct",
        "loan_to_deposit_ratio",
        "fhlb_advances_pct_assets",
    ],
    periods=8
)

print(metrics.to_dataframe())
Frequently Asked Questions
What is net non-core funding dependence? A UBPR liquidity ratio measuring how much of a bank’s long-term earning assets are funded by volatile non-core liabilities — brokered deposits, large uninsured time deposits, FHLB advances, wholesale borrowings — after netting out short-term liquid investments. A higher positive ratio means more of the illiquid asset book depends on funding that can reprice or leave quickly.
What counts as non-core funding? Brokered deposits (RCON2365), time deposits above $250,000, Federal Home Loan Bank advances, fed funds purchased, and other wholesale borrowings. The common thread is that these are rate-sensitive and lack the relationship stickiness that characterizes core deposits.
What range is typical for community banks? There is no regulatory bright line. Well-run community banks in the $300M–$2B range typically run in the low-single-digit to mid-teen percentages. Readings above 25% with a rising trend generate examiner scrutiny. Readings above 40% with simultaneous core deposit runoff are high-concern territory. Negative readings indicate core funding more than covers long-term assets — the most conservative position.
How did this ratio connect to the 2023 bank failures? Banks that failed in 2023 had funded long-duration assets with liabilities that proved less stable than their internal models assumed. High non-core dependence combined with large unrealized securities losses created a position where funding flight forced asset sales at losses — a self-reinforcing cycle. Both signals were visible in public regulatory data for multiple quarters before the failures.
Where does the data come from? Components are reported quarterly in the FFIEC 031/041/051 call reports — Schedule RC-E for deposits, Schedule RC-M for FHLB detail. The UBPR assembles these into a standardized ratio with peer group benchmarks. BankRegReports surfaces both the ratio and the underlying components with quarterly history dating to the early 2000s.
Does a high ratio automatically signal a problem? Not automatically. A bank in a deliberate expansion phase may run temporarily higher while building out its deposit franchise. The question is whether core funding is growing in parallel or whether the institution is becoming structurally dependent on wholesale sources with no near-term plan to reduce that dependence. That distinction only shows up in the trend over six to eight quarters.
What the UBPR cannot tell you is whether management knows this number, watches it in ALCO, and has a funding contingency plan that would actually work if the wholesale market tightened overnight. The ratio is the quantitative signal. The qualitative question — what happens if your FHLB line gets restricted or your brokered deposit broker stops bidding — is the one worth pressing in an exam, a board audit session, or an investment due diligence conversation.
The data in this post is available through the BankRegReports platform. Pull peer benchmarks, Call Report metrics, UBPR trends, and enforcement history for any FDIC-insured bank — no data engineering required. Explore the platform →