Bank Financial Analysis: A Practical Framework
When the Fed moved 525 basis points in 18 months, deposit beta for community banks averaged roughly 35–45%, meaning for every dollar of rate increase, deposit costs rose about 35 …
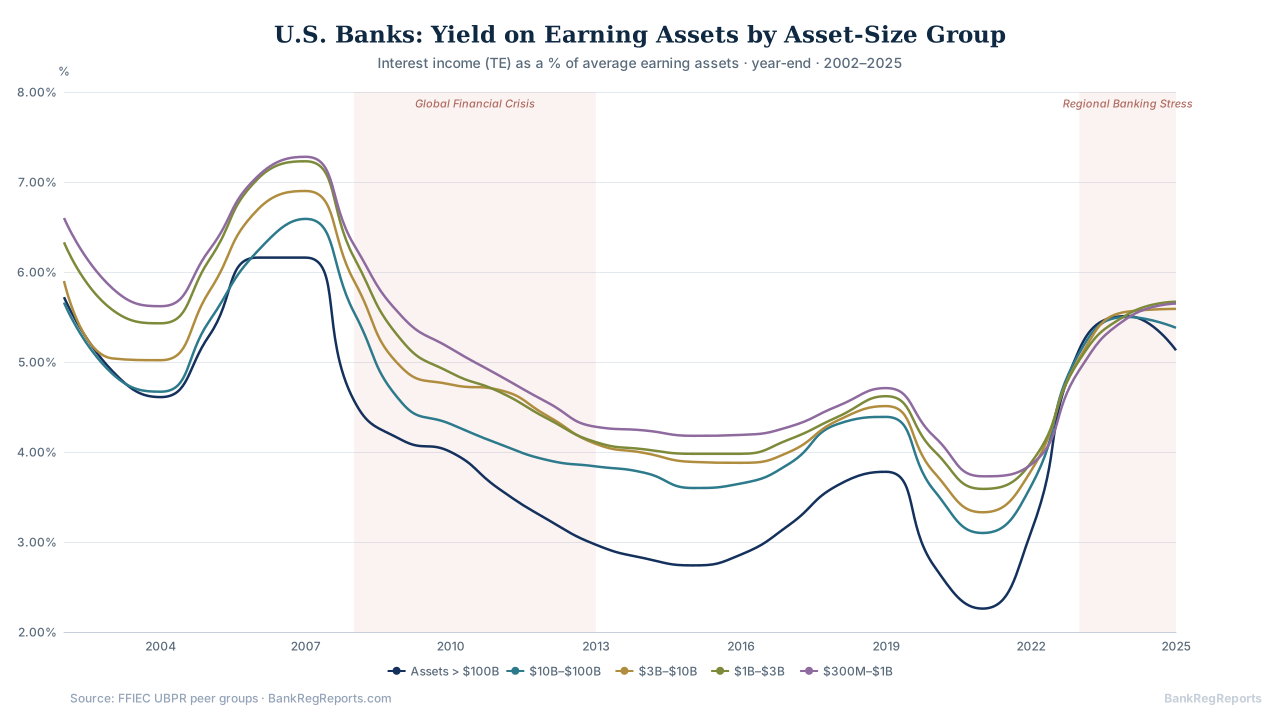
When the Fed moved 525 basis points in 18 months, deposit beta for community banks averaged roughly 35–45%, meaning for every dollar of rate increase, deposit costs rose about 35 to 45 cents. Most ALCO models going into that cycle had assumed 50–65%. That gap, between modeled behavior and actual depositor response, explains a lot about why net interest margin held up better than expected through 2022 and into early 2023, before the repricing pressure accelerated and NIM compression became the dominant story in every board deck from mid-2023 onward.
Understanding why your bank’s results differed from the model, and from peers, is the core discipline of bank financial analysis. The metrics are not complicated. The interpretation (knowing what number looks like a warning sign versus a strategic choice, knowing what an examiner will ask versus what the board actually needs to see) is what takes experience and context. This post lays out a working framework for community bank CFOs, treasurers, and credit officers building that foundation.
Which Metrics Actually Matter in Bank Financial Analysis?
Every regulatory exam, ALCO meeting, and board presentation orbits a fairly short list of financial ratios, all derived from the quarterly FFIEC Call Report, whose official source is the FFIEC. Here is what each means, where community banks typically land, and where examiners start asking questions.
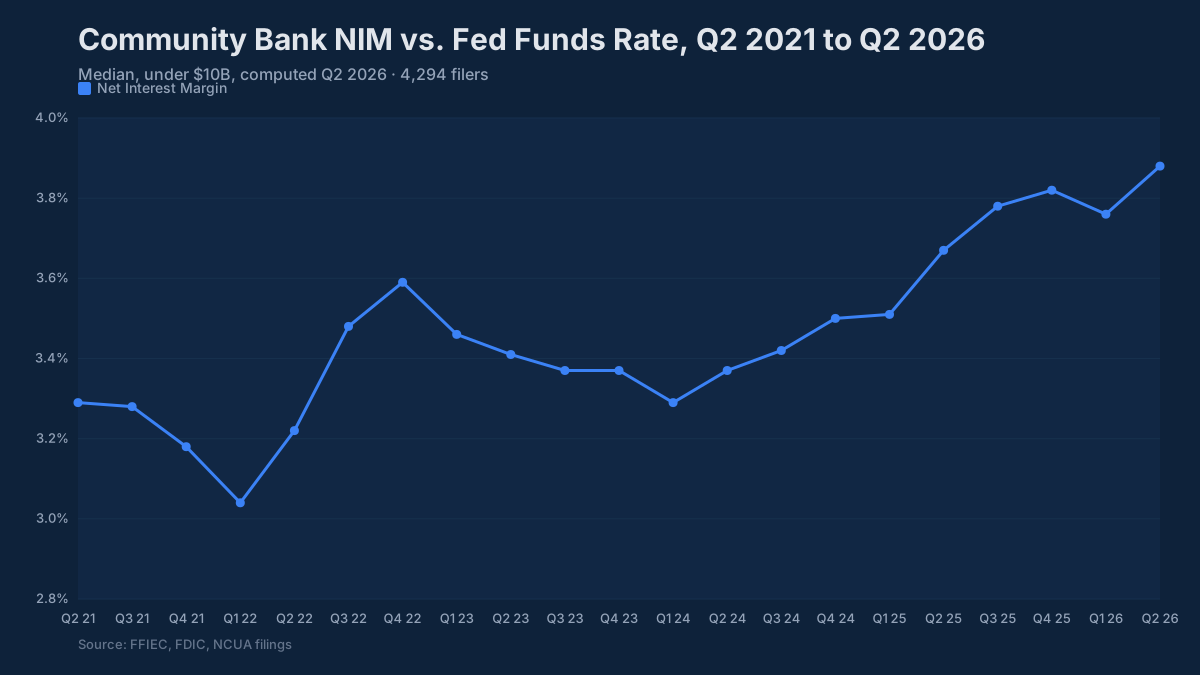
Net Interest Margin (NIM) is the ratio of net interest income to average earning assets. For community banks in Q1 2025, the median was roughly 3.3–3.5%. Below 3.0% is a conversation with your board about your funding mix and asset mix strategy. The examiner’s concern below that threshold is whether the institution can absorb credit losses without eroding capital.
Return on Assets (ROA) is the cleanest single-number measure of profitability. Community bank norms run 0.95–1.10%. Consistently above 1.20% signals strong operating leverage or a differentiated loan mix. Below 0.80% for two or more consecutive quarters warrants a written explanation in the ALCO package, and examiners will want to see a credible path back to peer performance. Below 0.50% starts touching CAMELS management and earnings component ratings.
Efficiency Ratio (non-interest expense divided by net revenue) measures how much it costs to generate a dollar of income. The community bank median sits in the 60–65% range. Below 60% is genuinely excellent, usually a sign of a disciplined cost structure or a loan-heavy, low-overhead model. Above 70% needs context: is the bank investing in new branches or technology, or is the cost base simply too heavy for the revenue base? Examiners do not automatically penalize a high efficiency ratio, but they expect management to explain it and show a trend line moving in the right direction.
Common Equity Tier 1 (CET1) capital ratio has a well-capitalized minimum of 6.5%, but the median for community banks runs around 13%, roughly double the regulatory floor. That buffer exists for good reason. Banks operating below 10% CET1 without a clear capital plan will face supervisory attention. Banks above 15–16% may face board questions about whether capital is being deployed productively or whether a special dividend, share repurchase, or acquisition conversation is warranted.
Nonperforming Loan (NPL) Ratio measures loans 90+ days past due or in nonaccrual status as a percentage of total loans. The community bank norm is 0.8–1.0%. Above 2.0%, examiners will request credit concentrations analysis and want to review loan loss reserves against classified assets. The NPL ratio is a lagging indicator; by the time it moves, the credit cycle has been turning for six to twelve months.
Net Charge-Off (NCO) Rate is the more forward-looking credit quality signal. Community bank norms run about 0.15% of average loans annually, matching the pre-pandemic average (FDIC Quarterly Banking Profile). In benign credit environments that number can stay below 0.20% for years. The jump from trough to trend, when charge-offs start normalizing after a period of unusual quiet, is one of the cleaner early warning signals in the ALCO toolkit.
Loan-to-Deposit Ratio (LDR) of 70–80% is the community bank sweet spot: enough lending activity to generate income, enough deposit cushion to avoid liquidity stress. Above 90%, an examiner will review the contingent funding plan and ask about wholesale funding reliance. At 100% or above, the institution is lending out every dollar of deposits plus some borrowed money, a position that requires explicit board approval of a higher-risk liquidity posture.
CRE Concentration is measured against risk-based capital. The interagency guidance threshold (issued in 2006 and still the operative standard) flags institutions where construction and land loans exceed 100% of capital or total CRE reaches 300% of capital after growing 50% or more over the prior 36 months. Crossing those thresholds does not trigger automatic action, but it does trigger enhanced supervisory scrutiny: management must demonstrate that the board is aware of the concentration, that underwriting standards are appropriate, and that stress testing has been conducted.
Building the ALCO Framework
An ALCO package that actually drives decisions has four working sections: liquidity position, interest rate risk, capital adequacy, and credit quality. Each section needs a current snapshot, a trend line of at least four to six quarters, and a peer comparison.
The peer comparison is where most community banks underinvest. It is easy to know your own NIM is 3.42%. It is much harder to know whether that is twenty basis points above your asset-tier peers because of a better loan mix, or twenty basis points below because your funding costs are elevated. Without the peer data, management is working without a map.
The FDIC Quarterly Banking Profile provides aggregate data by asset tier, but it is national and somewhat lagged. More useful for ALCO purposes is a custom peer group: ten to twenty banks with similar asset size, similar geography or market type, and similar business model. That is the comparison set that matters when you are explaining results to a board director who knows the local market.
For interest rate risk, the ALCO package should include the standard IRR metrics (Economic Value of Equity sensitivity under rate shocks of plus and minus 100, 200, and 300 basis points) alongside the NIM at Risk figure. Examiners reviewing IRR will compare your EVE sensitivity to peer institutions. A bank showing negative EVE in a down-rate scenario that is materially larger than peer median will be asked to explain its asset-liability positioning and hedging strategy.
What the Examiner Sees vs. What the Board Needs
The examination team and the board are looking at the same numbers for different reasons.
An examiner is calibrating CAMELS ratings. They want to know whether capital is adequate for the risk profile, whether earnings are sufficient to maintain capital, whether liquidity is managed with appropriate contingency plans, and whether management demonstrates awareness of where the institution sits relative to peers and regulatory thresholds. They are particularly focused on trend; a metric that is modestly below peer but clearly improving tells a different story than one that has been deteriorating for three consecutive quarters.
A board director needs simpler framing. The most effective board presentations anchor to three questions: Are we making money? Are our loans sound? Do we have enough capital to handle a stress scenario? A strong board package shows current performance, peer context, and a forward-looking view, not just trailing results. A board that only sees what happened last quarter cannot govern effectively.
Management teams sometimes err in one of two directions: overwhelming the board with operational detail that belongs in the ALCO committee, or presenting numbers without peer context that makes it impossible to assess whether performance is good. The right discipline is to give the board the peer-comparative story and bring the operational mechanics to the ALCO committee where the technical fluency exists to engage with them.
Using Regulatory Data for Strategic Insight
The same FFIEC and FDIC data that feeds regulatory reporting is available publicly and can answer strategic questions that go well beyond quarterly performance review. Which banks in your footprint are losing deposit share? What is the CRE concentration trend for your closest peers? How are banks your size managing their securities portfolio duration in the current rate environment?
You can search any FDIC-insured institution at BankRegReports and pull peer group comparisons without downloading a single ZIP file or reconciling a single MDRM code. The platform normalizes the underlying FFIEC and FDIC data, handling the unit conversions, form-type reconciliation, and cross-source consistency that makes raw regulatory data genuinely difficult to work with. On the Pro plan, export to Excel and you have ALCO package data ready for your committee presentation.
The banks that use peer data best do not treat it as a one-time project. They build it into the quarterly ALCO cycle: updating the peer comparison every quarter, watching for institutions that are pulling away from the group in either direction, and using that signal to sharpen their own strategic positioning. In an environment where deposit competition, credit normalization, and rate uncertainty are all in play simultaneously, that kind of systematic awareness is worth building now.
The benchmarks and peer data referenced in this post are available through the BankRegReports platform, no data engineering required. Search any FDIC-insured bank, pull peer group comparisons, and, on the Pro plan, export to Excel for your ALCO package or board presentation.