Efficiency Ratio Benchmarks by Asset Size: Community Banks
Where U.S. banks fall on the efficiency ratio (lower is better); most cluster in the 50-70% range.

This is the benchmark companion to What Is the Bank Efficiency Ratio? Formula and Drivers. That post covers the formula and the inputs. This one is about the numbers: where community banks actually run by asset tier, what examiners and boards make of the number, and the methodology traps that make two identical banks report different ratios.
Why the Benchmark Matters More Than the Number
Consider a hypothetical $750M community bank that ran a 71% efficiency ratio through 2023 and explained it to their board the same way every quarter: they were investing in people ahead of loan growth. By mid-2024, loan growth had not materialized, NIM had compressed 40 basis points, and the efficiency ratio was 74%. The examiners noticed. The board finally asked a harder question. That sequence, a defensible story that gradually stops being defensible, plays out at community banks of every size when efficiency ratio drift goes unaddressed for too long.
The efficiency ratio measures how many cents a bank spends to generate a dollar of revenue. At 60%, the bank spends 60 cents per dollar. Lower is better. It sounds simple, and the underlying math is not complicated: noninterest expense divided by the sum of net interest income and noninterest income. But the ratio concentrates two different problems into one number, expense control and revenue generation, which means the same ratio can mean entirely different things depending on which side is moving.
Where Do Community Banks Actually Stand?
The FFIEC Uniform Bank Performance Reports publish efficiency ratios on a consistent methodology across all FDIC-insured institutions, with securities gains and losses kept out of revenue and with intangible amortization and goodwill impairment included in overhead expense; the official source is the FFIEC. That is the version worth anchoring to for any serious peer comparison. Press-release “adjusted efficiency ratios” have typically been optimized for the most flattering presentation management can defend; the UBPR version is what examiners use.
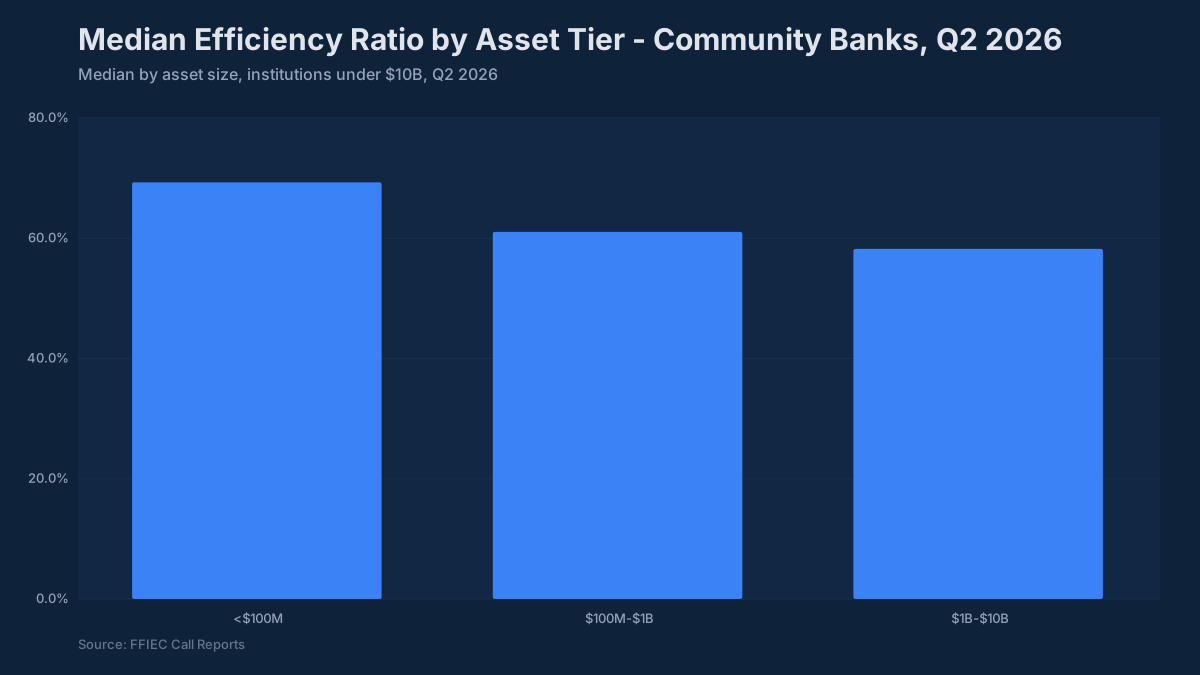
Here is where community banks have been running, based on FFIEC UBPR peer data:
| Asset Tier | Median Efficiency Ratio | Strong Performer | Needs Explanation |
|---|---|---|---|
| Under $300M | 64–68% | Below 68% | Above 80% |
| $300M–$1B | 60–65% | Below 62% | Above 75% |
| $1B–$3B | 59–64% | Below 60% | Above 72% |
| $3B–$10B | 55–59% | Below 57% | Above 70% |
The directional principle is straightforward: larger institutions spread fixed costs over more revenue-generating assets and typically have more fee income to support the denominator. A bank with $400M in assets running 68% is not necessarily underperforming; one running 78% in the same tier is in a different conversation.
The 60% threshold gets cited so frequently it has become something close to doctrine in community banking circles. Below 60% signals strong operating leverage. Above 70% is where board members start asking about the plan, and where examiners start asking whether the plan is working. Neither threshold is a hard regulatory limit, but both represent points where the narrative has to carry more weight than the number.
What Actually Moves the Number
Efficiency ratio deterioration almost always starts on one of two sides, and the management response differs depending on which.
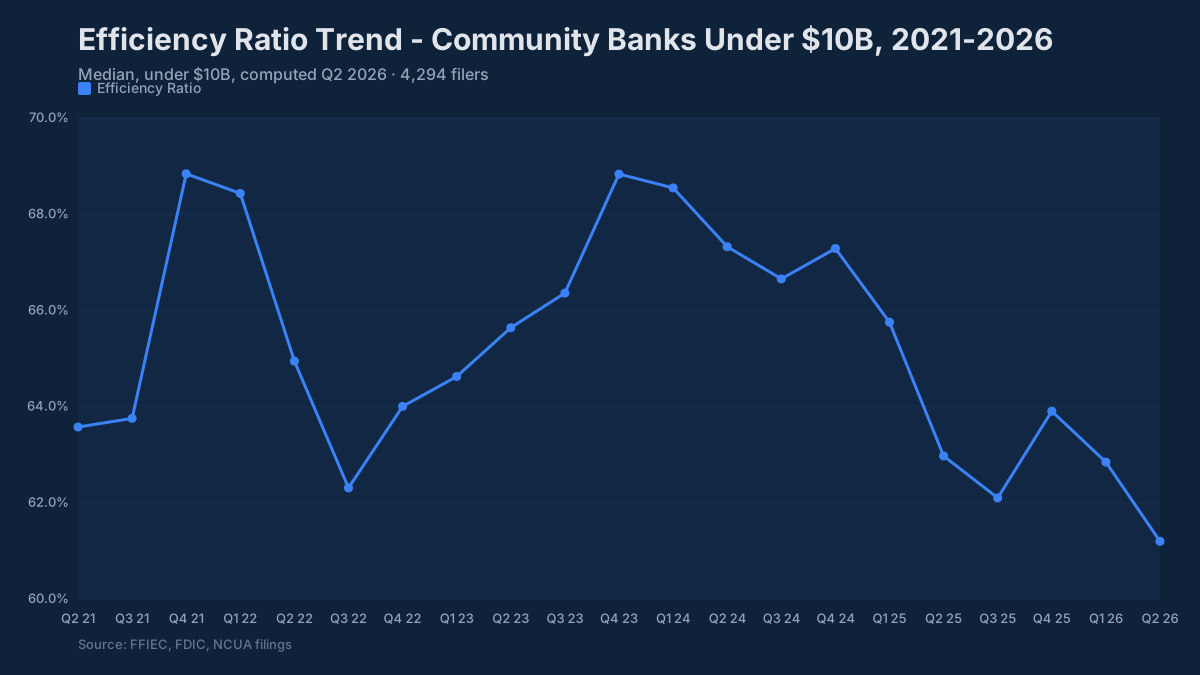
Revenue compression without expense adjustment is the more common pattern at community banks in the current rate environment. NIM peaked for most institutions in late 2022 and fell through early 2024 as deposit costs repriced higher; it has since recovered to new highs (median 3.88% for banks under $10B at June 30, 2026). A bank that budgeted 3.5% NIM for 2024 and landed at 3.1% saw roughly a 40-basis-point drag on the revenue denominator, which translates directly into efficiency ratio pressure even if expense discipline was perfect. This is the version that management can honestly describe as an external headwind, but it still requires a response on the expense side if revenue recovery is not imminent.
Expense growth that outpaces revenue is the version that raises more questions. Personnel expense typically represents 50 to 60 percent of total noninterest expense at a community bank. When total noninterest expense rises 8 percent year-over-year and personnel is driving the majority of that increase, the next question is whether the hiring shows up in production. New lenders generate origination volume. A technology buildout should eventually reduce processing costs or improve deposit retention. If neither is visible in the revenue trend after two or three quarters, the investment thesis needs revisiting.
Occupancy deserves its own line in any efficiency analysis for banks that built or expanded branch footprints during the low-rate period. Fixed occupancy costs do not flex when deposit volumes shift or when remote-capture adoption reduces branch transaction counts. Comparing occupancy expense as a percent of assets across peers in the same geographic market is one of the more direct ways to surface whether a branch network has become a structural drag.
How Examiners Read the Efficiency Ratio
Examiners do not use the efficiency ratio as a standalone trigger, but they use it as a pattern-recognition tool. A ratio that has been rising for three or four consecutive quarters prompts questions about expense discipline and whether the revenue outlook supports the current cost structure. A ratio above 70% combined with declining NIM and flat fee income is the combination that generates the most examiner interest, because it suggests a bank where neither side of the equation is working in management’s favor.
The examiner lens also pays attention to what management does with the ratio in internal reporting. Banks that track the UBPR-consistent version and compare it against their own historical trend and a defined peer group demonstrate that management understands where they stand. Banks that exclusively report an internally adjusted version, stripped of items management considers nonrecurring, raise questions about whether the discipline is real or performed.
One area that draws specific attention in the current environment is the relationship between efficiency ratio and capital generation. A bank running a 72% efficiency ratio and a 0.80% ROA is generating less retained earnings per year than a bank at 63% and 1.10% ROA. When capital ratios are already running closer to well-capitalized minimums than well-capitalized comfort zones, an elevated efficiency ratio is not just a profitability concern; it is a capital adequacy question in slow motion.
Presenting This to the Board
The most effective efficiency ratio presentation to a board combines three elements: where we are, where peers are, and what is driving the gap.
A single number on a slide, “efficiency ratio: 67.3%”, requires the board to supply the context themselves, which they cannot do without the peer data. A more useful presentation shows the bank’s trailing six-quarter trend on one axis alongside the UBPR peer median for the relevant asset tier. That framing answers the two questions board members actually care about: are we getting better or worse, and how do we compare to comparable institutions.
The decomposition that holds up best in board discussions separates the ratio into its revenue contribution and expense contribution. If efficiency ratio has moved from 64% to 68%, was that a two-point revenue decline, a two-point expense increase, or some combination? That answer determines whether the board should be asking about the loan pipeline, the deposit pricing strategy, or the staffing plan, and it prevents the conversation from stalling on the ratio itself rather than the underlying drivers.
You can pull peer benchmarks directly from the BankRegReports platform, filtered by asset tier, geographic market, or charter type, and, on the Pro plan, export to Excel for the ALCO package or board presentation. The peer data uses the UBPR-consistent methodology, so the comparison is apples-to-apples rather than comparing your UBPR number against a competitor’s press-release adjusted figure.
A Note on Methodology Before You Benchmark
Two banks can report meaningfully different efficiency ratios while being operationally identical, entirely due to methodology choices. The three most common sources of divergence in peer comparisons:
Securities gains and losses flow through noninterest income on the income statement. In a rate environment where banks are realizing losses on repositioning their portfolios, those losses reduce the denominator, which makes the efficiency ratio look worse. The UBPR strips them out. Many bank-reported figures do not.
Mortgage banking income is volatile and episodic. In a rising rate environment, gain-on-sale volumes contract sharply. A bank that generated $3M in mortgage fee income in 2021 and $600K in 2023 saw its denominator shrink from that source alone, which mechanically lifted its reported efficiency ratio even if expenses were held flat.
Intangible amortization from prior acquisitions runs through noninterest expense. A bank that completed an acquisition two years ago may be carrying $1M to $3M annually in amortization charges that inflate the numerator. The UBPR includes this amortization in overhead expense (UBPRE037), so an acquirer’s UBPR ratio runs higher than a bank-reported figure that excludes it. Adjust one side before you compare them.
When you are building a peer comparison for the board or for ALCO, knowing which definition each institution is using matters as much as the number itself. The BankRegReports platform applies consistent UBPR-based definitions across all institutions, which is the most reliable starting point for apples-to-apples peer analysis.
The banks that manage efficiency ratio most effectively are typically the ones that treat it as a management tool rather than a reporting obligation. That means tracking it quarterly against a consistent peer group, decomposing it into revenue and expense drivers at each reporting cycle, and having a clear internal threshold, not just the 60% rule of thumb, that triggers a formal management review. The peer data to do that analysis is available now in a form that does not require a data team to access.
The benchmarks and peer data referenced in this post are available through the BankRegReports platform, no data engineering required. Search any FDIC-insured bank, pull peer group comparisons, and, on the Pro plan, export to Excel for your ALCO package or board presentation.