FFIEC UBPR Data: The Ground Truth for Bank Analysis
If you have ever sat in an ALCO meeting and argued about a peer comparison, or built a bank financial model from scratch, you have run into the same problem: …
If you have ever sat in an ALCO meeting and argued about a peer comparison, or built a bank financial model from scratch, you have run into the same problem: the data underneath the analysis is murky. Vendors give you numbers but not formulas. Peer groups look clean until you try to reproduce one ratio and discover a 200-basis-point discrepancy with no explanation. Regulatory examiners use a different denominator than your CFO.
FFIEC UBPR data is the regulators’ answer to that problem. The Uniform Bank Performance Report is the agencies’ own standardized view of every commercial bank’s financial condition, derived from Call Report filings and built on published formulas. When examiners walk into your institution, the UBPR is what they are looking at, so it is the baseline any serious bank analysis has to reconcile to.
What Is the UBPR, Actually?
The UBPR is a quarterly report published by the FFIEC (Federal Financial Institutions Examination Council) for every FDIC-insured commercial bank and savings institution. It translates the raw Call Report, which is a multi-schedule regulatory filing with thousands of data items coded in the MDRM (Microdata Reference Manual) system, into hundreds of standardized, peer-adjusted performance ratios. The official source is the FFIEC, which publishes those ratios grouped into numbered report pages.
The UBPR does more than restate a bank’s numbers. It sets them against a peer group of similarly sized institutions, computed with the FFIEC’s own published formulas. That means:
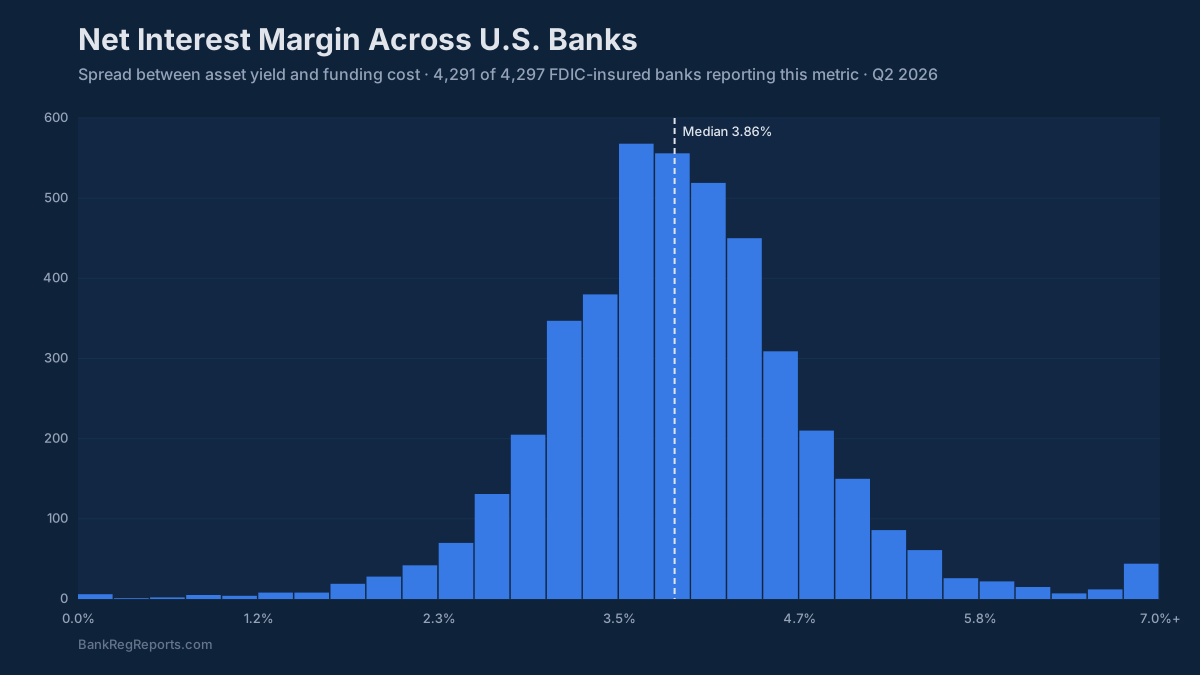
- NIM is computed the same way across every bank. Average earning asset denominators use a specific averaging methodology. You are not comparing apples to oranges when you put two banks’ net interest margins side by side.
- Efficiency ratios use a consistent definition. Noninterest expense over net revenue, with specific inclusions and exclusions defined by the FFIEC, not by each bank’s IR team.
- Capital ratios reflect the regulatory calculation, not the most favorable presentation a bank’s management might choose for an investor deck.
The OCC, FDIC and Federal Reserve all train their bank examiners on it. If you are doing bank credit analysis, peer benchmarking, stress testing or M&A due diligence, the UBPR is the reference you calibrate to. For a page-by-page walkthrough of the report itself, see how to read a UBPR report.
Why Raw UBPR Data Is Hard to Work With
The FFIEC does publish UBPR data; you can download it from the CDR (Central Data Repository) as flat files. Working with those files is where practitioners hit a wall, for reasons we have documented in detail.
The raw files use MDRM item codes. RIAD4093 is not self-explanatory. You need the data dictionary, the formula documentation, and the knowledge of which codes are live versus deprecated across which reporting periods. The MDRM has evolved over decades, and codes get redefined, retired, and replaced without obvious continuity.
Peer group calculations are embedded in the UBPR itself, but reproducing them from raw data requires knowing how the FFIEC constructs peer groups (17 numbered groups by average assets since February 26, 2026; before that, smaller banks were also split by office count and metropolitan location) and replicating that logic in your own pipeline.
On top of that, the data is not always clean at the source. Restatements happen. There are gaps in certain reporting periods, particularly for smaller institutions that file on different schedules. Building a reliable, production-quality dataset from raw UBPR files requires significant engineering.
Enterprise data platforms and legacy financial data providers offer pre-processed versions, but they typically charge subscription fees sized for institutional clients, deliver data through proprietary interfaces that do not fit into a Python-based analytical workflow, and do not expose the underlying formulas. You get a number but not the methodology. That is a problem when you need to defend your analysis to an examiner or a credit committee.
The UBPR in Context: What It Covers and What It Does Not
UBPR covers commercial banks and savings institutions that file the Call Report (FFIEC 031 and 041/051 forms). It does not cover:
- Bank holding companies, which file the FR Y-9C with the Federal Reserve. Consolidated holding company data requires a separate source.
- Credit unions, which file the NCUA 5300 Call Report and have their own equivalent of the UBPR in NCUA’s Financial Performance Report (FPR).
- Investment company subsidiaries or broker-dealers, which report to the SEC via EDGAR.
For a complete picture of a banking organization (the holding company structure, subsidiary banks, thrift entities, and any SEC-registered parent), you need to stitch together FFIEC Call Report data, Federal Reserve NIC entity data, Y-9C filings, FDIC institution data, and often SEC EDGAR filings. That cross-source join, with consistent entity identifiers, is what separates a real analytical platform from a single-source data dump.
BankRegReports was built for that join. The platform ingests all of these sources (FFIEC Call Reports, UBPR, FDIC, Federal Reserve NIC and Y-9C, NCUA 5300, and SEC EDGAR) and exposes them through a unified, consistent API with stable entity identifiers and published formula lineage.
Why Published Formula Lineage Matters
One thing that distinguishes BankRegReports from legacy financial data providers is that the formulas are not a black box. The platform maintains a crosswalk from every served metric back to its MDRM source items, form variant (031 versus 041/051), and any period-specific definitional changes. When a ratio diverges from what you expect, you can trace it.
Take the efficiency ratio. Different institutions and different data providers apply different treatments to gains on securities sales, amortization of intangibles, and nonrecurring items. The FFIEC has a specific definition. When your model uses that definition consistently, rather than a vendor-specific variant, your peer comparisons are defensible to an examiner, a rating agency, or an investment committee.
It also matters for temporal consistency. The Call Report forms have changed over time. CECL adoption shifted how allowance for credit losses appears in the data. Schedule restructurings in 2020 and 2022 moved items across line numbers. A reliable UBPR pipeline has to handle those transitions without silently breaking ratios. BankRegReports tracks these changes and documents them in the formula lineage.
Who Should Be Using UBPR Data
FFIEC UBPR data is not only for bank regulators. Practitioners who rely on it include:
- Bank analysts and credit officers building peer comparison models or evaluating M&A targets
- ALCO teams and CFOs benchmarking NIM, funding costs, and capital positioning against peer medians each quarter
- Risk managers calibrating internal stress tests against historical UBPR distributions
- Fintech companies and lenders evaluating bank partners or building institution-level scoring models
- Academic researchers studying bank behavior, interest rate transmission, or regulatory effects across large panels of institutions
Each of those users eventually has to defend a number to someone else, and the UBPR is the version of the number the other side of the table already trusts.
Where to Start
Pick one ratio you report every quarter, pull the UBPR value for your bank and two peers, and try to reproduce it from the Call Report line items. If you match, you understand the formula. If you do not, the gap usually traces to an averaging method, a definitional change, or a difference between sources, and finding which one teaches you more than any summary page.
You can browse UBPR ratios for any bank on the UBPR pages, or pull them programmatically through the BankRegReports Data API.