MDRM Codes Explained: What Community Bankers Should Know
Your examiner walks in with a spreadsheet showing your net interest margin sitting 40 basis points below peer.
Your examiner walks in with a spreadsheet showing your net interest margin sitting 40 basis points below peer. They pulled that peer data from the same public Call Report filings your institution submits every quarter, through a system built on something called MDRM codes. Understanding what those codes are, and what data sits behind them, gives you a material advantage in any exam or peer comparison conversation.
What Are MDRM Codes, and Why Should You Care?
MDRM stands for Micro Data Reference Manual. It is the Federal Reserve’s master dictionary of every data item collected across FFIEC reporting forms: the Call Report (FFIEC 031, 041, and 051), the Y-9C consolidated holding company report, and the data that feeds the Uniform Bank Performance Report. Every number your bank submits to regulators is tagged to an MDRM code, a four-letter prefix plus a four-character item number (usually digits, sometimes a letter and three digits, such as P793 or J474). The official source is the FFIEC.
The prefix tells you what type of data you are looking at. RCFD is balance sheet data covering all offices, domestic and foreign. RIAD is income statement data. BHCK is the holding company equivalent from the Y-9C. The suffix identifies the specific concept: 2170 is total assets, 4074 is net interest income, 3210 is total equity capital. Total risk-based capital is 3792, and it uses a different prefix family: RCOA3792 on the FFIEC 041 and 051, RCFA3792 on the 031. What each item actually includes and excludes is set by the FFIEC instruction book, not by the code. When examiners cite a number, when the UBPR shows a ratio, when your peer group comparison lands in the ALCO package, it traces back to one of these codes.
This matters for three practical reasons. First, when your ALCO analyst or third-party vendor pulls peer data, you want to know they are pulling the right field, not confusing a domestic-only figure with a consolidated one, or mixing up a pre-CECL allowance code with its post-2020 equivalent. Second, when you are preparing for an exam and the examiner asks about a specific ratio, knowing what data underlies it lets you verify the calculation rather than accept their number at face value. Third, when you are doing strategic planning (comparing your deposit cost structure to $1B–$3B peers, or looking at CRE concentration across your competitive market), the quality of that comparison depends entirely on whether the same underlying MDRM codes are being used consistently.
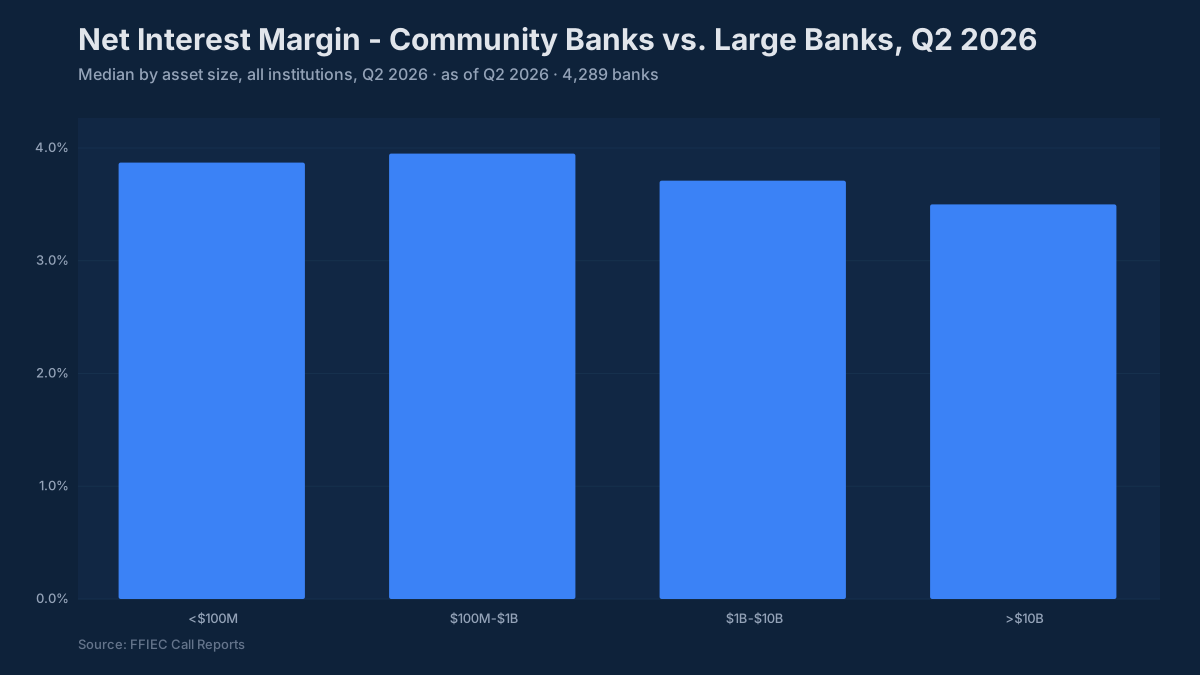
That NIM chart tells the story that dominated every ALCO meeting from 2022 through 2024. Community banks initially benefited from asset-side repricing (variable rate loans and maturing fixed-rate paper rolling into higher yields) while deposit costs lagged. Then deposit betas caught up. Cumulative deposit betas for community banks through the full 2022–2023 hiking cycle landed in the 35–55% range, roughly two quarters behind what large banks experienced due to their heavier reliance on wholesale and brokered funding. By Q1 2025, the median NIM for $1B–$10B community banks had recovered to around 3.3–3.5%, and by June 30, 2026 it was 3.70% (FDIC BankFind).
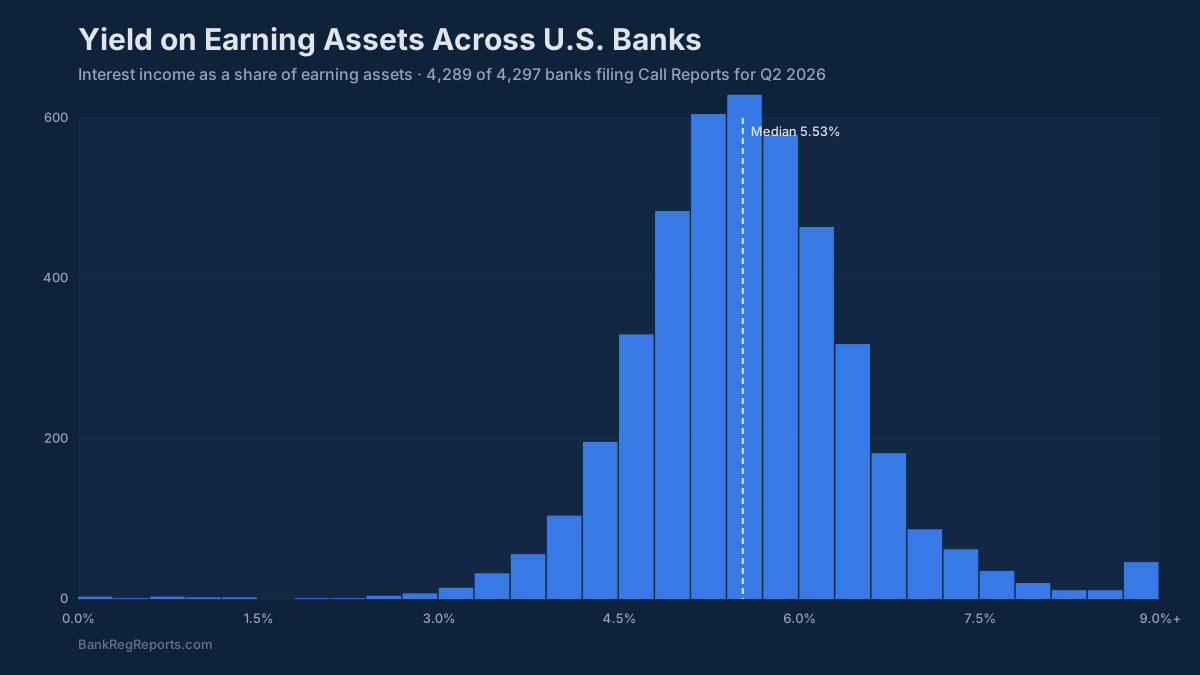
The Metrics Examiners Pull From Call Report Data
Understanding which MDRM codes matter most means understanding the CAMELS exam framework and which ratios drive each component.
Capital (C): Examiners track CET1, Tier 1 leverage, and total risk-based capital ratios. The median CET1 for community banks sits near 15%, well above the 6.5% well-capitalized minimum, but examiners start paying attention when a bank approaches 10% or when capital ratios are declining faster than earnings would explain. For community banks with concentrated CRE portfolios, capital adequacy conversations almost always involve the screens in the 2006 interagency guidance on CRE concentrations: total CRE at 300% of risk-based capital with growth of 50% or more over the prior 36 months, and construction and land development at 100%. A bank at 280% CRE concentration with a 12% CET1 gets a very different conversation than one at 280% with a 9% CET1.
Asset Quality (A): The two numbers the credit committee watches most closely (NPL ratio and net charge-off rate) come directly from Call Report schedules RC-N and RI-B. A noncurrent loan ratio below 1.0% is solid for most community banks; the median was 0.45% across all banks at June 30, 2026 (FDIC BankFind). Above 2.0% draws examiner attention. Above 3.0% can lead to Matters Requiring Attention. Net charge-off rates near 0.15% annualized were typical for FDIC-defined community banks in Q1 2025 (FDIC Quarterly Banking Profile); anything above 0.75% warrants a closer look at loss trend and reserving adequacy.
Earnings (E): ROA around 1.1–1.3% is typical (median 1.26% for banks under $10B at June 30, 2026). Strong community banks run above 1.20%; anything below 0.80% gets board questions about the earnings trajectory. The efficiency ratio is where boards and examiners converge most visibly: a ratio in the 60–65% range is standard, below 60% is excellent, and above 70% means either your revenue base is under pressure or your expense growth has outpaced your asset growth. Neither is comfortable to explain in an exam.
Liquidity (L): The loan-to-deposit ratio does not have a hard regulatory ceiling, but a ratio above 90% consistently generates examiner questions about contingent liquidity planning. The typical community bank range is 70–80%. Post-Silicon Valley Bank, regulators have been asking harder questions about uninsured deposit concentration and on-balance-sheet liquidity buffers even at institutions that look fine on traditional LTD metrics.
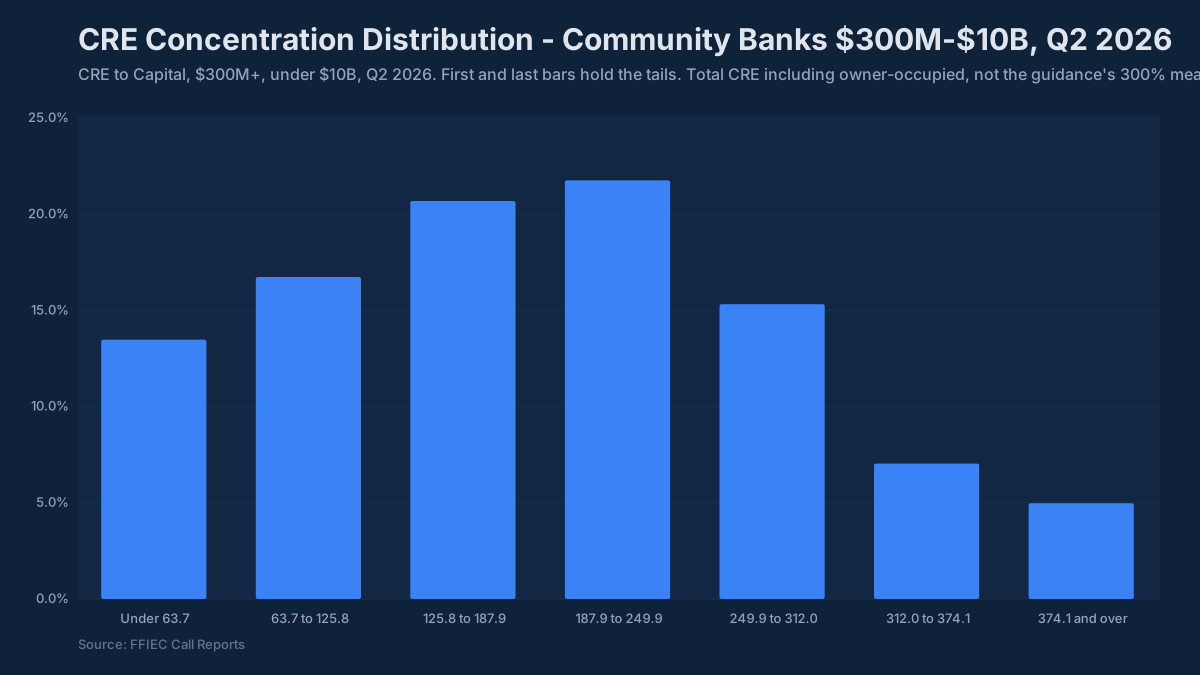
The CRE concentration distribution above shows the practical reality: a meaningful share of community banks operate above the 300% level used in the guidance’s screen and manage that position through strong capital ratios, demonstrated underwriting standards, and stress testing. Being above 300% is not automatically a problem, but it changes the conversation with your examiner, and it requires documentation that your board understands and has formally accepted the concentration risk.
The UBPR: Where MDRM Data Becomes Benchmarks
The Uniform Bank Performance Report is the FFIEC’s own analysis layer on top of Call Report data. Rather than raw MDRM codes, the UBPR publishes derived ratios (NIM, ROA, efficiency ratio, capital ratios) calculated consistently across all reporting institutions and grouped into peer cohorts by asset size.
For ALCO and board packages, UBPR data is often more directly useful than raw Call Report figures because the peer grouping is already done. You can see exactly where your NIM sits within the distribution for your asset tier, whether your noninterest income as a percent of assets is above or below peer median, and how your loan growth compares to institutions in your size category. The FFIEC updates UBPR data quarterly, a few weeks after Call Reports come in (they are due 30 days after quarter end).
The limitation is that the standard UBPR peer groups are set by the FFIEC. The FFIEC CDR does let you build custom peer group reports, but that is a manual, report-by-report exercise. For a repeatable comparison of banks in your specific geographic market or competitive footprint, you need to go back to the underlying Call Report data and select institutions by geography, asset size, and business model characteristics yourself.
That is exactly what the BankRegReports platform handles on the Pro plan. You define your peer group (by state, asset tier, charter type, loan mix, or any combination) and pull the same standardized metrics the UBPR publishes, but for your specific competitive set. The underlying data is the same FFIEC Call Report filings; the difference is that you control the peer definition. Export to Excel and the output drops directly into your existing ALCO template.
What Changes in the Data and Why It Matters
Call Report data is not static even for past periods. Banks file amended Call Reports when they discover reporting errors, which means a ratio you pulled six months ago may look slightly different today. CECL adoption (phased from 2020 through 2023 for most community banks) created structural breaks in allowance and provision time series: a bank’s allowance-to-loans ratio jumping from 0.90% to 1.30% in a single quarter may reflect CECL adoption, not a sudden deterioration in credit quality. The post-CECL community bank peer median for allowance to loans sits around 1.1–1.4%.
MDRM codes themselves get redefined across regulatory cycles. Codes were retired and new ones introduced around CECL, around the Basel III capital changes, and periodically as reporting forms are revised. If you are building trend analysis that spans these transition points (particularly anything crossing the 2020 CECL adoption or the 2015 Basel III implementation), you need to verify that the codes you are using mean the same thing across the full period.
The BankRegReports platform tracks these definitional changes and maintains historical consistency across reporting periods, which is part of what makes it practical for multi-year trend analysis.
A Practical Use Case: ALCO Deposit Cost Benchmarking
Here is how this typically plays out in practice. Your CFO wants to show the board whether your cost of deposits is running above or below peer as rates potentially begin to move down. The relevant MDRM codes are in Schedule RC-E (deposits) and Schedule RI (interest expense), but the meaningful comparison is not the raw dollar figures; it is the cost of deposits as a percent of average deposits, benchmarked against institutions of similar size and funding model.
On the Pro plan, you log into BankRegReports, select your institution, define a peer group of $500M–$2B community banks in your region, and pull cost of deposits over eight trailing quarters. The platform returns a table showing your institution’s ratio alongside the peer median, 25th percentile, and 75th percentile for each quarter. Export that to Excel, drop it into your ALCO package, and you have a defensible peer comparison grounded in actual FFIEC filings, not an index from a vendor whose methodology you cannot audit.
That is what MDRM data access looks like when it is built for bankers rather than data engineers. The underlying regulatory infrastructure is the same; the friction of getting from raw codes to usable benchmarks is what BankRegReports removes.
The metric that will define the next ALCO cycle is probably deposit repricing as the Fed works through whatever rate path lies ahead. Community banks that know exactly where they sit in the deposit cost distribution, and can show the board a credible peer comparison, will be better positioned to explain their NIM trajectory and defend their funding strategy. That starts with knowing what is in the data.
The benchmarks and peer data referenced in this post are available through the BankRegReports platform, no data engineering required. Search any FDIC-insured bank, pull peer group comparisons, and, on the Pro plan, export to Excel for your ALCO package or board presentation.