Why FDIC, Call Report and Peer Data Differ for the Same Bank
Pull total assets for the same community bank from the FDIC BankFind suite, the FFIEC Call Report, and the UBPR, and you may get three different numbers. Not wildly different. …
Pull total assets for the same community bank from the FDIC BankFind suite, the FFIEC Call Report, and the UBPR, and you may get three different numbers. Not wildly different. Close enough to be confusing, far enough apart to matter when you are computing a tier 1 leverage ratio, flagging a trend break for the board, or building a peer comparison for your ALCO package. This is not a data quality failure. It is a consequence of three systems built by three agencies for three different regulatory purposes, each with its own amendment timing, consolidation rules, and normalization logic.
Understanding why the numbers diverge tells you which source to trust for which analysis, and where the real risks of mixing them lie.
Why Does the Same Bank Show Up Differently Across Sources?
The U.S. bank regulatory data ecosystem was not designed from a single blueprint. It accumulated across decades of agency mandates, legislative changes, and reporting reforms.
FFIEC Call Reports (FFIEC 031/041/051) are the primary financial filing for insured depository institutions. Banks submit them quarterly to their primary federal regulator; the data is aggregated by the FFIEC and published through the Central Data Repository. Call Reports contain thousands of MDRM-coded line items covering the balance sheet, income statement, off-balance-sheet exposures, capital, and credit quality. This is the source of record for bank-level financial data, and the official source is the FFIEC. When examiners cite numbers, they are working from Call Report figures.
The UBPR (Uniform Bank Performance Report) is not a raw filing. It is an analytical product the FFIEC builds on top of Call Report data, applying annualization conventions, ratio definitions, and peer group assignments. When you look at your bank’s UBPR NIM or efficiency ratio, you are looking at FFIEC-processed output, not the raw submission. That processing is intentional and consistent across the peer universe, which is precisely what makes UBPR ratios useful for benchmarking. But it also means UBPR figures will not always match what you calculate directly from the raw Call Report items.
FDIC BankFind Suite aggregates Call Report data along with FDIC’s own supervisory records, but with its own schema choices, publication cadence, and charter-tracking logic. The FDIC’s core interest is deposit insurance and institution-level surveillance. Its data model reflects that, particularly in how it handles merger dates, predecessor institutions, and restatements.
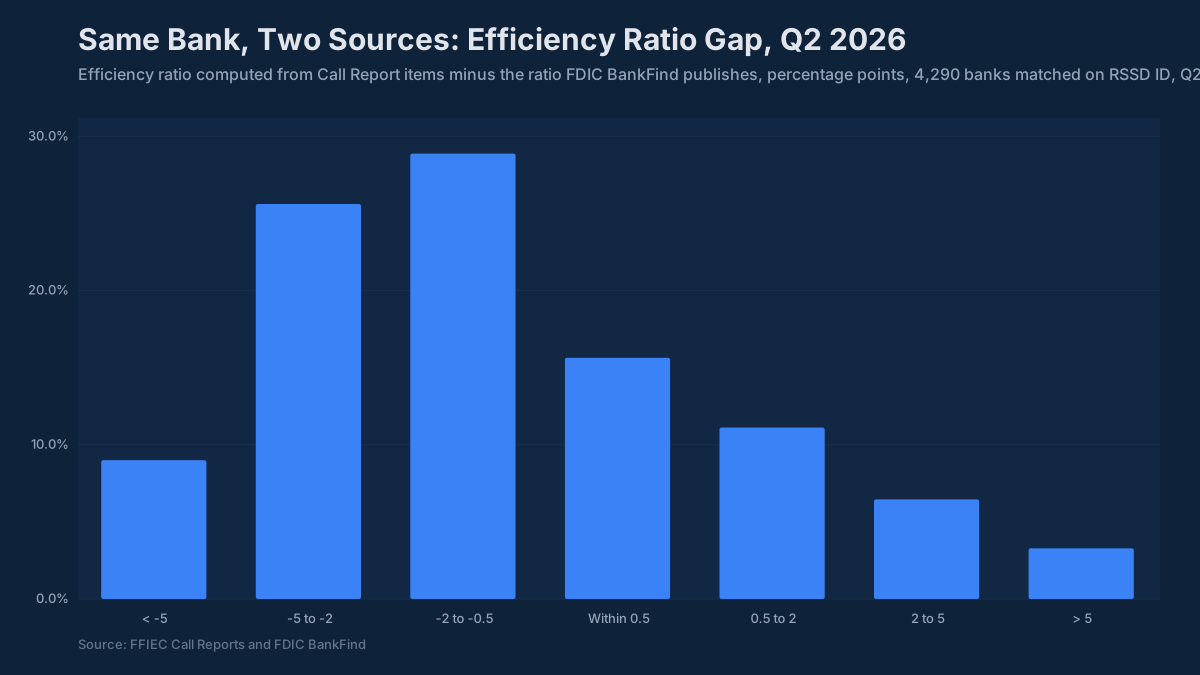
The gap is not academic. For the second quarter of 2026, only about one bank in six gets the same efficiency ratio, within half a percentage point, from a calculation on its Call Report items and from the ratio FDIC BankFind publishes for it.
Four Reconciliation Gaps That Will Catch You Off Guard
Restatement timing. A bank files its Q1 Call Report in April, amends it in July after discovering a classification error, and amends again in October when the auditors sign off on a reclassification. The FFIEC CDR publishes all amendments. The FDIC BankFind suite incorporates amendments on its own schedule. UBPR data is typically rebuilt on a fixed calendar, so it may reflect an earlier version of the filing than the current CDR snapshot. If you build a time series by mixing sources without controlling for amendment vintage, you will create phantom trend breaks. The bank’s position did not change; the filing did. For capital ratios in particular, where a single reclassification can move CET1 by 10–20 basis points, amendment vintage matters.
Consolidation level. Call Report data is charter-level: the insured depository institution only. Federal Reserve Y-9C data covers the bank holding company at the consolidated level. FDIC data is charter-level. UBPR is charter-level. This distinction is mostly invisible for standalone community banks, but it becomes significant when a holding company owns multiple subsidiary banks, or when a community bank operates through an intermediate holding company structure. Comparing holding company consolidated financials from a Y-9C against subsidiary Call Report data without flagging the consolidation difference is one of the most common errors in peer analysis, and one of the hardest to catch because the numbers look plausible.
UBPR annualization conventions. The UBPR annualizes income statement items consistently across the peer universe: Q1 figures are multiplied by four, Q2 by two, Q3 by 4/3. Raw Call Report filings report year-to-date cumulative figures for income items, not annualized, not quarterly. If you compute NIM yourself from raw MDRM items and compare it to the UBPR’s published NIM without applying the same annualization logic, you will see a divergence that has nothing to do with your bank and everything to do with how the math works. This specific mismatch has generated more unnecessary data-quality investigations on ALCO desks than almost any other reconciliation issue.
Merger and acquisition handling. When Bank A acquires Bank B, the combined entity’s Call Report balance sheet shows a step-change on the acquisition date. The FDIC tracks predecessor and successor relationships through its certificate number system and publishes historical series that attempt to smooth this. But the FDIC’s approach to acquisition dating differs from simply reading the raw filing time series, and peer group assignments in the UBPR can shift post-merger as the bank crosses asset tier thresholds, changing the peer universe mid-series. Neither of these is an error. Both require awareness when you are building a board presentation that tracks your institution against a stable peer group over time.
Which Source to Use for Which Analysis
The discipline here is straightforward once you accept that no single source wins across every use case.
For income statement and balance sheet items in your own ratio calculations, start with Call Report MDRM items. You control the denominator definition and annualization convention, which means your NIM calculation is comparable to your peers’ NIM calculation only if you apply the same conventions. Using UBPR ratios as your starting point and then reverse-engineering them is harder than starting from the raw items and applying UBPR conventions yourself.
For peer benchmarking, the thing your ALCO package and board presentation actually need, use UBPR ratios as the standard. The FFIEC applies consistent normalization across every institution in the peer universe. When you compare your efficiency ratio or NIM to the peer median, you want that median computed the same way yours is. UBPR delivers that. Peer medians for $1B–$10B community banks as of Q1 2025 were: NIM approximately 3.3–3.5%, efficiency ratio 60–65%, ROA 0.95–1.10%, CET1 around 13%.
For institution-level metadata (charter history, acquisition dates, predecessor relationships, branch counts, geographic footprint), the FDIC BankFind data is the cleanest source. The FDIC has invested decades in building and maintaining those historical linkages. Do not try to reconstruct them from raw Call Report filing sequences.
For holding company context, Federal Reserve Y-9C and NIC data adds the parent entity layer. This matters when you are assessing capital availability at the bank level (can the holding company inject capital?), understanding intercompany funding arrangements, or benchmarking against peers whose capital ratios reflect holding company structure.
What This Means for Your ALCO Process
Most community banks encounter this reconciliation problem the first time they try to build a systematic peer comparison. Someone downloads FDIC data for efficiency ratios, someone else pulls UBPR peer medians, and a third person exports from the bank’s internal reporting system, and the three sets of numbers disagree enough to generate an hour of unproductive conversation about which one is right.
All three can be right within their own definitions. The question is whether you are comparing like with like.
The practical fix is to pick a single source convention for each metric category and apply it consistently. UBPR conventions for benchmarking ratios. Call Report MDRM for raw balance sheet and income items. FDIC for entity metadata. Federal Reserve Y-9C for holding company structure. Document those choices in your ALCO methodology so the next analyst on your team is not starting from scratch.
The BankRegReports platform standardizes all four of these sources under a single data model with consistent entity linking via RSSD ID, controlled amendment vintage, and explicit source tagging. You search for your institution or define a peer group, and the platform surfaces the reconciled figures, not raw files that require a data engineering project to make comparable. For community bank ALCO teams that need clean peer benchmarks without a team of analysts rebuilding cross-source join logic, that is the relevant value proposition: you get the data in a form that is ready for your Excel templates or board presentation without the reconciliation overhead.
One thing worth watching as you build your peer comparison methodology: the rate cycle of 2022–2024 created some unusual cross-source divergence in NIM figures specifically because deposit repricing lagged asset repricing by two or more quarters. Banks that were aggressive deposit pricers showed UBPR NIMs that peaked earlier and compressed faster than slower-repricing peers. If your peer group spans both aggressive and conservative deposit strategies, the peer median NIM is doing a lot of averaging work. Pulling the distribution, not just the median, shows where your institution sits relative to the full range, which is a more useful board conversation than a single benchmark number.
The benchmarks and peer data referenced in this post are available through the BankRegReports platform, no data engineering required. Search any FDIC-insured bank, pull peer group comparisons, and, on the Pro plan, export to Excel for your ALCO package or board presentation.