Why Bank Regulatory Data Is Harder to Use Than You Think
Your ALCO package is due Friday. You want to show the board how your cost of deposits compares to fifteen peers, a straightforward ask. You pull the public FFIEC data, …
Your ALCO package is due Friday. You want to show the board how your cost of deposits compares to fifteen peers, a straightforward ask. You pull the public FFIEC data, build the comparison, and two of those fifteen banks show a deposit cost under ten basis points in a 500-basis-point rate environment. You spend half a day investigating whether they have an unusual deposit mix, some brokered-deposit quirk, or a filing error. Eventually you discover that those two banks filed on a different form variant, and the item codes you used are not populated the same way on that schedule. The data was not wrong. The join logic was.
That is not an edge case. That is Tuesday in regulatory data work.
The Real Problem with FFIEC, FDIC, and Fed Data
Public regulatory data (the FFIEC Call Report, UBPR, FDIC institution database, Federal Reserve Y-9C filings, NCUA 5300) is genuinely valuable. The Call Report alone covers roughly 4,300 active FDIC-insured banks and thrifts with line-item granularity going back decades, and the official source is the FFIEC. The problem is not access. Most of this data is free. The problem is that using it correctly requires knowing a set of traps that are not documented anywhere in one place, and that practitioners discover slowly through failed models, restatements, and uncomfortable conversations with examiners or investment committees.
Here are the four that cause the most damage.
Unit chaos. Different sources store dollar values in different units with no column-level metadata to flag which is which. Call Report dollar items are in thousands. NCUA 5300 dollar items are whole dollars. Some ratios are stored as integers scaled by 100, so a NIM of 3.3% might be stored as 330, not 0.033 or 3.3. The NCUA 5300 is particularly aggressive about this: rates and ratios are whole-number integers, while dollar figures are in whole dollars rather than thousands. If you join a Call Report dollar figure to a UBPR ratio without accounting for this, your output will be wrong in a way that looks completely reasonable at a glance. A NIM of 330 basis points does not trigger an obvious alarm. You will not catch it until you benchmark against a bank you know well or run a sanity check against published UBPR figures.
Form variant routing. The Call Report is not one form; it is three. The FFIEC 031 covers large banks with foreign offices. The FFIEC 041 covers domestic-only banks of $5 billion or more and smaller banks that do not use the 051. The FFIEC 051, introduced in 2017, is an abbreviated version for the smallest and least-complex institutions. The same conceptual line item (total loans held for investment, for example) may live on a different schedule, under a different MDRM code, depending on which form the filer used. A naive pull that does not account for filer type will silently drop institutions or miscalculate ratios. This is the exact mechanism behind the deposit-cost scenario at the top of this piece.
UBPR coverage gaps. The UBPR delivers approximately 625 peer-benchmarked ratios built from Call Report source data, and those ratios cover the metrics that appear on most ALCO and board dashboards. But there are more than 3,800 live MDRM codes in active use on current Call Report filings. The 3,000-plus codes outside UBPR coverage are where you find line items that matter for specific credit and risk questions: collateral breakdowns, credit quality stratification by loan type, derivative notional detail, the components of non-interest expense at the sub-category level. If your analysis requires any of that granularity, UBPR alone will not get you there.
Entity linkage. A bank and its holding company are different legal entities that file different forms to different regulators. The bank files a Call Report and appears in the FDIC institution database. The holding company files a Y-9C with the Federal Reserve and appears in the NIC database. For peer analysis purposes, this matters because capital ratios, loan concentrations, and off-balance-sheet exposures can differ materially between the bank-level and holding-company-level view. Reconciling NIC parent chains (keyed on the Federal Reserve’s RSSD ID) to FDIC certificate numbers, and then linking those to SEC CIK numbers for institutions that are publicly traded, is a multi-table join problem with enough edge cases to consume a week the first time you do it properly.
What the Numbers Looked Like in Early 2025
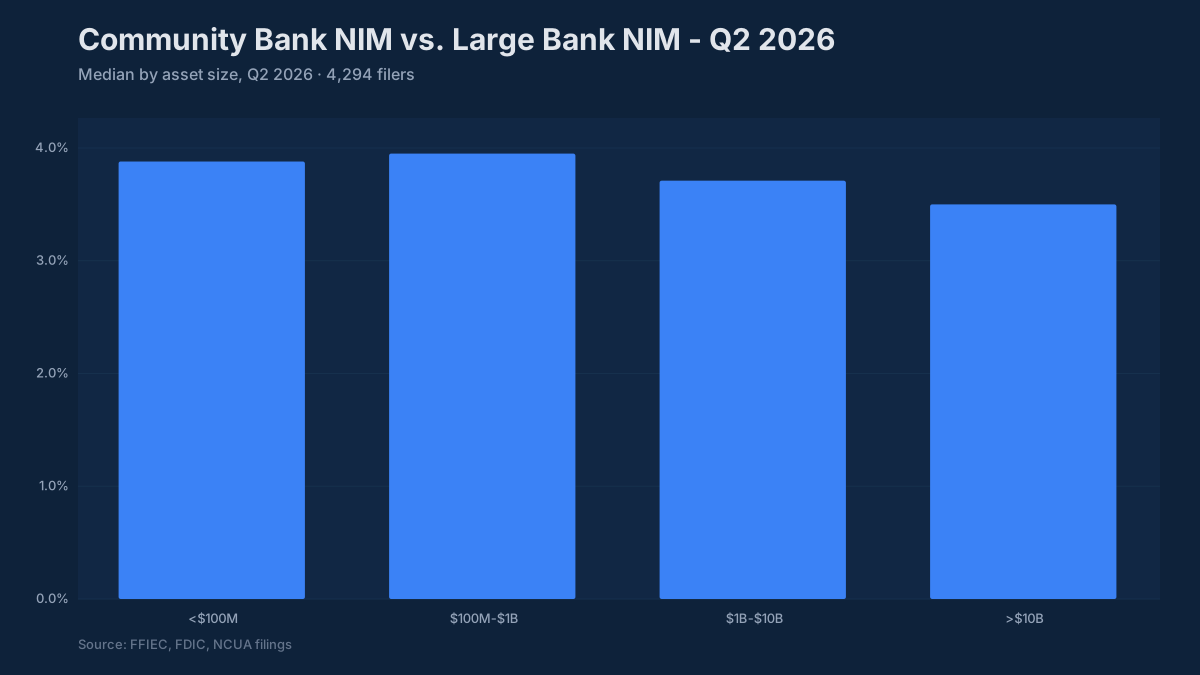
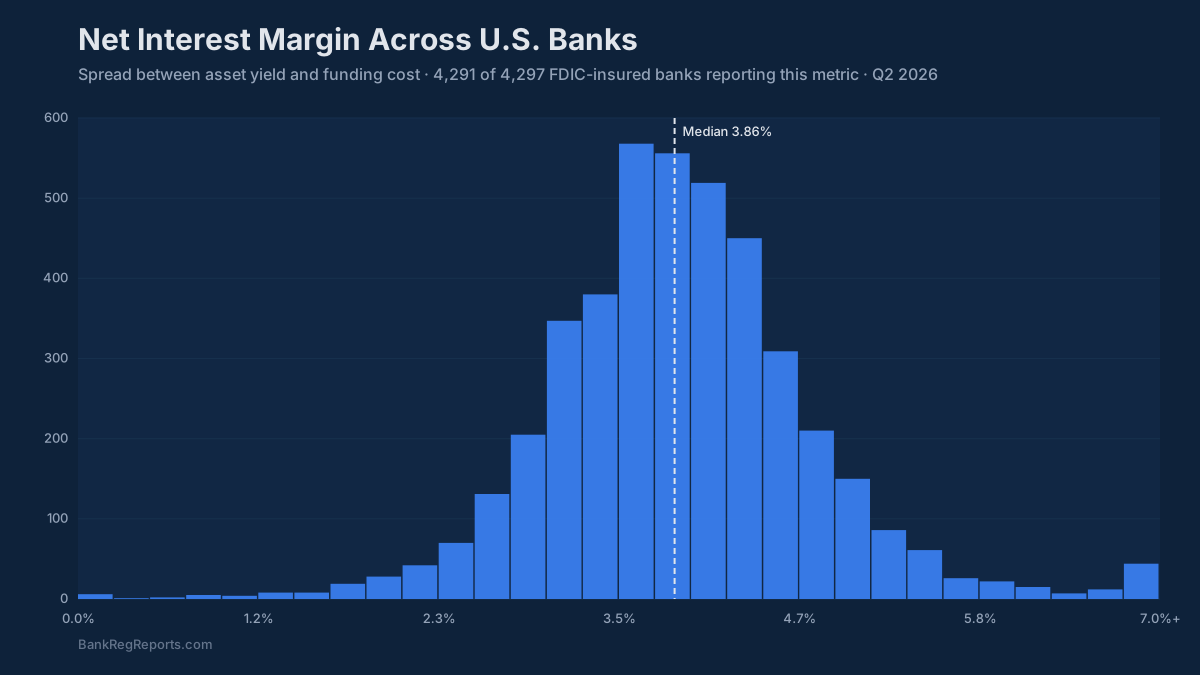
For context (these figures are as of Q1 2025): community bank NIM averaged roughly 3.3–3.5% in Q1 2025, after a period of compression. The compression came from deposit repricing: institutions that locked in low-cost deposits through 2022 eventually had to reprice them as customers migrated to money markets and CDs. Deposit betas for the 2022–2024 hike cycle ran 35–55% across the community bank peer group, but with a lag of roughly two quarters. Banks that were still showing strong NIM in early 2023 often absorbed the repricing pain through late 2023 and into 2024.
ROA for $1B–$10B institutions ran 0.95–1.10% in Q1 2025. Anything above 1.20% puts a bank in the top quartile of its peer group. Below 0.80% starts to attract board scrutiny and examiner interest in expense discipline and revenue diversification. CET1 ratios at community banks median around 13%, comfortably above the 6.5% well-capitalized minimum, though examiners increasingly focus on the trajectory rather than the level: a bank declining from 14% to 11% over three years raises different questions than a bank that has held steady at 11% for a decade.
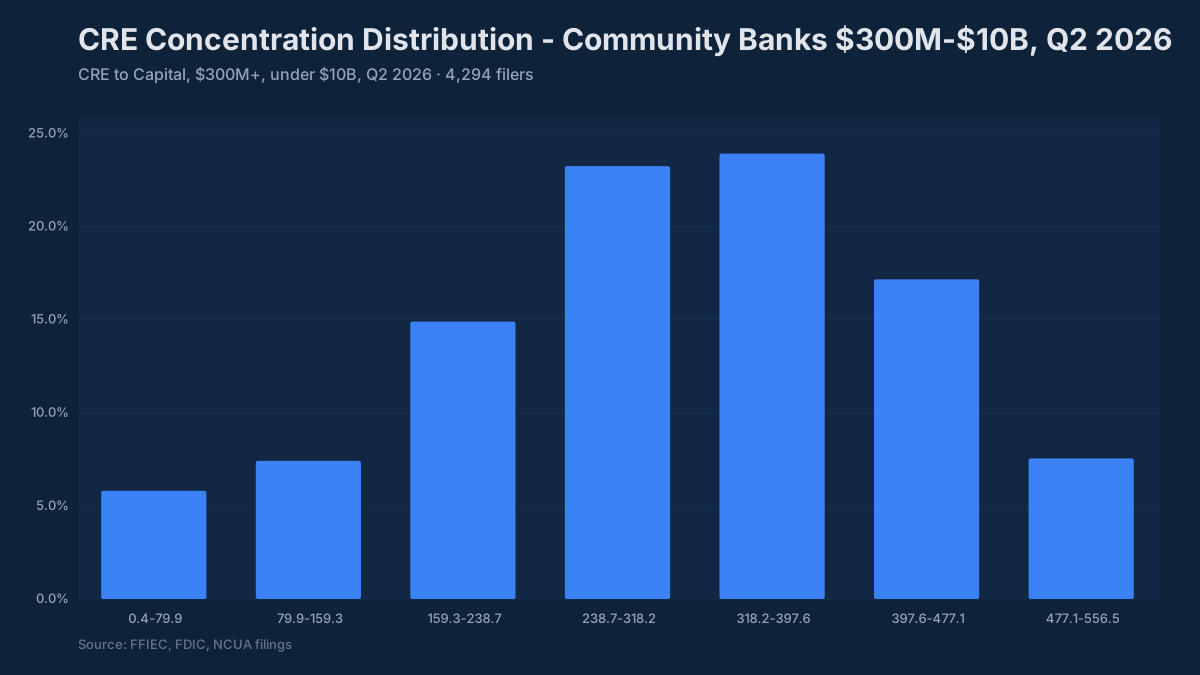
NPL ratios ran about 0.4–0.55% at the median for community bank peer groups through early 2025, up from the historically low post-pandemic lows but not yet at the 2.0% threshold where examiner attention intensifies. Net charge-offs at community banks ran 0.15% annualized in Q1 2025, matching the pre-pandemic average, per the FDIC Quarterly Banking Profile. The industry-wide rate was materially higher at 0.67%, reflecting credit card losses concentrated at the largest banks, so do not benchmark a community bank against the industry figure. CRE concentration remains the most consistent ALCO and examiner conversation topic: the interagency guidance thresholds (300% of risk-based capital for total CRE, 100% for construction and land) have not changed since 2006, but the share of community banks approaching or exceeding them has grown with property value appreciation and portfolio concentration in commercial real estate.
Why Does This Matter for Your ALCO Package?
The reason unit errors and form routing problems matter is not abstract: they distort the peer comparisons that your ALCO, credit committee, and board use to evaluate performance. A NIM that looks 40 basis points above peer because of a units mismatch leads to a very different capital deployment conversation than one that is actually 40 basis points above peer. A deposit cost comparison that excludes 051-filers from the peer group understates the competitive pressure at smaller institutions.
Examiners use these same public datasets, often through UBPR peer analysis tools. When your internally-prepared peer comparison tells a materially different story than the examiner’s UBPR printout, you spend exam time explaining discrepancies rather than discussing strategy. Getting the underlying data right is not a technical nicety; it is preparation for the conversations that matter.
How BankRegReports Handles This
The BankRegReports platform was built by practitioners who have lived these problems: people who have built ALCO models, gone through regulatory exams, and spent unreasonable amounts of time debugging unit mismatches in Call Report schedules. The platform normalizes raw filings from the FFIEC Call Report (all three form variants), UBPR, FDIC institution database, Federal Reserve NIC and Y-9C, NCUA 5300, and SEC EDGAR into a consistent schema with units resolved, form variants routed, and entity linkage pre-joined.
You access it through the web platform at bankregreports.com: log in, search your institution or define a peer group by asset size and geography, and pull the comparison. No data engineering required. The deposit cost figure you see is in the same units for every institution in the peer group, regardless of which Call Report form they filed. The NIM is a ratio, not a scaled integer. The CRE concentration is calculated against the correct risk-based capital base for each filer. Export to Excel and you have the data for your ALCO package or board deck in a format your team already knows how to work with.
For fintech teams or analysts who build automated reporting workflows, BankRegReports also exposes the same normalized data through an API, but that is a secondary use case. The primary interface is the web platform, designed for the analyst building the board package, not the engineer building the pipeline.
The Normalization Burden Belongs on Infrastructure, Not Analysts
The unit inconsistency in regulatory data is not the result of careless analysis. It is a consequence of forms designed over decades, by different agencies, for different regulatory purposes, without a shared schema. The FFIEC did not design the Call Report to be queried by bank CFOs building peer comparisons. It was designed for examination.
Every bank, research firm, and consulting shop has historically built its own version of the same unit-resolution logic, made its own set of mistakes, discovered the same traps independently, and absorbed the same analytical cost. The smarter approach is to solve it once, correctly, and let the people who actually need the data spend their time on the analysis rather than the plumbing.
If your next ALCO cycle includes a peer benchmarking refresh (NIM trend, deposit costs, capital adequacy, CRE concentration), pull the BankRegReports comparison first and see what the data looks like when the form routing and unit normalization are already done.
The benchmarks and peer data referenced in this post are available through the BankRegReports platform. No data engineering required. Search any FDIC-insured bank, pull peer group comparisons, and, on the Pro plan, export to Excel for your ALCO package or board presentation.