FFIEC Data Quality: Unit and Schema Inconsistencies
A community bank CFO runs the same NIM calculation every quarter for three years. One quarter, the number comes back at 340% instead of 3.4%. Nothing in the source file changed visibly. No error message. The formula is identical.
A community bank CFO runs the same NIM calculation every quarter for three years. One quarter, the number comes back at 340% instead of 3.4%. Nothing in the source file changed visibly. No error message. The formula is identical. What actually happened is that the raw FFIEC data shifted how a rate field was scaled, and the model absorbed it silently.
This is not a hypothetical. It is one of the most common ways that ALCO models and peer-benchmarking workbooks break, and it happens specifically because FFIEC regulatory filings were built for regulatory compliance, not for downstream analysis. Understanding where these inconsistencies come from helps community bank finance teams know what to look for, what to demand from their data vendors, and why certain benchmark figures sometimes look wrong when they come out of raw Call Report files.
How Do FFIEC Unit Inconsistencies Enter Your ALCO Data?
The FFIEC Call Report, UBPR, and Y-9C share a common reference system called the MDRM, the Micro Data Reference Manual. (The NCUA 5300 Credit Union Call Report does not; it uses NCUA’s own account codes, such as ACCT_010, defined in NCUA’s account description file.) The MDRM is the authoritative dictionary that defines what each data code means. What it does not guarantee is that the unit convention for a given code stays consistent across the entire history of the filing archive.
Several patterns create unit problems that show up in practice.
Rates stored as integers. In the NCUA 5300, interest rate fields are stored as integers scaled by 100: a new vehicle loan rate of 5.66% is stored as 566 in the raw file. The UBPR does not do this; its ratios arrive as percent values (a NIM of 3.42% is 3.42). If your analysis platform or the Excel export you received mixes the two conventions, or skips the 0.01 scale factor on NCUA rate fields, every affected rate and ratio metric in your ALCO package is wrong by two orders of magnitude. As of Q1 2025, the community bank NIM average sat around 3.3–3.5% for institutions in the $1B–$10B asset range. If your data shows something closer to 330–350, the scale is wrong, not the bank.
Dollar amounts in thousands, most of the time. Call Report dollar figures are filed in thousands, which is well understood. What is less well understood is that other sources handle this differently. UBPR dollar items are also reported in thousands. SEC filings have shifted too: effective January 3, 2023, the SEC’s Form 13F amendments moved reported holdings values from thousands of dollars to whole dollars, a 1,000x break for any pipeline reading 13F holdings across that date. Validation checks that look for “implausibly small” numbers catch some of these shifts. Checks that only look for “implausibly large” numbers in a universe that includes actual large banks often do not.
Code retirement without backward restatement. FFIEC periodically retires MDRM codes and issues replacements. Sometimes the replacement carries the same economic meaning under a new identifier. Sometimes the perimeter shifts: what counts as “past due 90+ days” or “nonaccrual” has evolved across examination cycles, particularly through the CECL transition period from 2020 to 2023. If an analysis tool is keyed to the old code and does not track the redefinition history, the time series has a structural break at the point of retirement. NPA ratios are particularly susceptible to this because Schedule RC-N has seen multiple perimeter changes that affect how nonaccrual and past-due categories are classified.

What This Does to Real ALCO Metrics
The practical damage clusters around the metrics that matter most to ALCO committees and examiners.
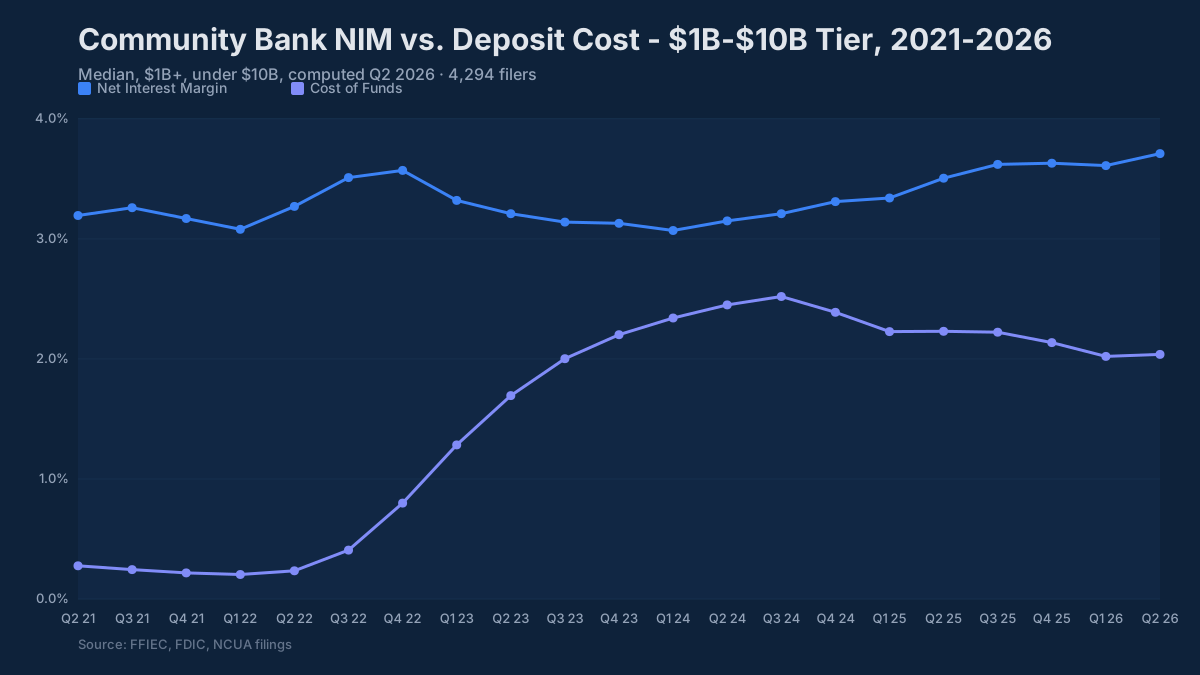
Net interest margin is the most exposed metric because it involves both a dollar amount in the numerator (net interest income) and an average earning asset base in the denominator, plus rate fields for the component yields and costs. A unit error in any of those legs propagates into every downstream metric: yield on loans, cost of funds, rate sensitivity gap analysis, and interest rate risk model inputs. For context, community bank NIM bottomed in early 2024 and recovered through the year, reaching roughly 3.3–3.5% by Q1 2025. A bank running 3.3% NIM at that point was in roughly normal territory. One showing 330 in a raw data feed has a scale problem, not a NIM problem.
Capital ratios present a different risk. CET1, Tier 1, and Total Capital ratios are computed from raw MDRM dollar inputs but published in the UBPR as rounded percentages. The community bank median CET1 sits near 15%, well above the 6.5% well-capitalized minimum. If a recomputed capital ratio diverges from the UBPR-published figure, the diagnostic question is whether the difference comes from a unit error in the raw inputs, a denominator methodology issue (the leverage ratio divides by quarterly average total assets, while risk-weighted assets are period-end figures), or an actual methodology difference from the regulatory definition. Those three causes produce different magnitudes of error and require different fixes.
NPA ratios are complicated by the CECL transition. Through 2023, institutions that adopted CECL earlier show different allowance-to-loan ratios than late adopters, and the RC-N perimeter changes mean that what is counted in the 90+ day past-due bucket shifted. As of Q1 2025, the typical community bank NPL ratio ran about 0.4–0.5%. Ratios above 2.0% warrant examiner attention; above 3.0%, they are a primary focus. A bank that appears to have a 10% NPL ratio in a benchmarking tool very likely has a unit or field-definition problem rather than a genuine credit crisis.
The Form-Variant Problem in Peer Comparisons
Community banks do not file identical Call Reports. Larger banks file schedules and items that FFIEC 051 filers skip entirely (Schedule RC-H, which only 031 filers complete; Schedule RC-D trading assets and RC-Q fair value detail, which are not on the 051; and items the 051 collects only semiannually or annually). When peer-benchmarking data is assembled by flattening all filers into a common wide table, the missing schedules for smaller banks produce nulls that look identical to genuine missing data. If the benchmarking tool treats those structural nulls as zeros, every peer comparison involving those fields is corrupted for community banks.
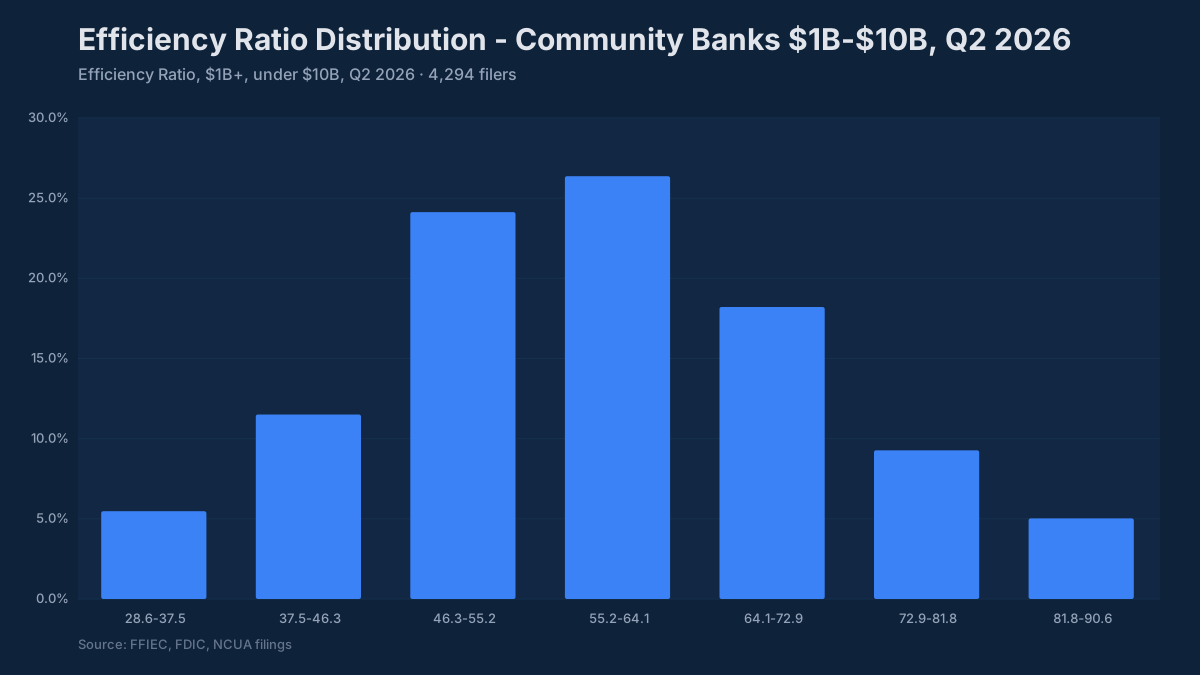
This matters practically for efficiency ratio benchmarking. The $1B–$10B peer group runs efficiency ratios in the 60–65% range under normal conditions. Below 60% is genuinely strong operating performance. Above 70% draws board questions about expense management. But if the noninterest income denominator is constructed from a mix of schedules that not all institutions file, the comparison is not apples-to-apples across the peer group, and a bank that looks like an efficiency outlier may simply be filing a different form variant than the institution it is being compared against.
What to Look for in Your Data Source
Community banks typically access FFIEC data through one of three paths: raw FFIEC bulk downloads (available to anyone, but require significant data engineering to use correctly), third-party data aggregators bundled into core banking software, or purpose-built platforms that normalize the data before delivery.
The questions to ask about any source are specific. For rate and ratio fields: are they expressed as percentages (e.g., 3.42 for NIM) or as basis points (342) or as raw integers from the filing (342, but meaning 3.42%)? For dollar fields: are all values normalized to the same unit, typically thousands, regardless of whether the source was a Call Report schedule, a UBPR derived table, or a holding company Y-9C? For time series: when an MDRM code was retired and replaced, does the series stitch across the break or drop to null? For peer comparisons: how are form-variant nulls handled, as missing data or as structural zeros?
The answers to those questions determine whether the peer benchmark your CFO presents at the next board meeting is accurate or whether it is off by a factor that would reverse the conclusion.
The BankRegReports platform maintains a validated unit registry built from MDRM item-type classifications and empirical checks against anchor institutions with published investor supplements. When a rate field is stored as an integer in the raw filing, the platform applies the correct scale factor before the number reaches any user-facing output. Form-variant nulls are returned as typed missing data rather than zero, so peer averages exclude them rather than pull them toward zero. MDRM code retirement events are tracked so that time series stitch correctly across redefinition boundaries.
You can search any FDIC-insured institution, build a peer group by asset tier or charter type, and export the results directly to Excel for your ALCO package or board presentation, without touching a raw FFIEC file or knowing what the MDRM is. The data that comes out has already been through the normalization layer.
A Practical Audit for Your Current Workbooks
If you are relying on FFIEC data from any source (internal downloads, a vendor feed, or manually assembled Call Report schedules), a few quick checks reveal whether unit handling is correct.
Pull your NIM for the past eight quarters from your current source and compare it to the UBPR peer average for your asset tier published directly by the FFIEC at ffiec.gov. If your figure and the UBPR figure differ by more than 5–10 basis points, you have either a unit error or a denominator methodology difference. The UBPR uses quarterly average earning assets; period-end asset figures produce a modestly different result and are a common source of drift.
Do the same check for your CET1 ratio against the UBPR-published figure for the same quarter. Capital ratios should match very closely (within 10–20 basis points) because the calculation is well-defined. A larger divergence usually means the risk-weighted asset base is being computed differently than the regulatory definition.
For NPA ratios, compare your 90+ days past due plus nonaccrual total to the Schedule RC-N reported figures from the raw Call Report. If your figure is materially different, check whether your source is including or excluding items that changed perimeter through the CECL transition.
These checks do not require a data engineering background. They require knowing what the UBPR says for your own institution and comparing it to what your ALCO model is using. The gap, if there is one, identifies where the unit or methodology problem lives.
As deposit betas stabilize (community banks ran cumulative deposit betas of 35–55% through the 2022–2023 hiking cycle, about two quarters behind large banks) and credit normalization continues to push NCO rates back toward their long-run norms, about 0.15% at community banks, the accuracy of ALCO inputs matters more, not less. Rate sensitivity models built on miscalibrated NIM inputs produce incorrect duration gap estimates at exactly the moment when managing that gap is the primary treasury decision.
The benchmarks and peer data referenced in this post are available through the BankRegReports platform, no data engineering required. Search any FDIC-insured bank, pull peer group comparisons, and, on the Pro plan, export to Excel for your ALCO package or board presentation.