FFIEC Call Report Data: What It Contains and How to Use It
When the Fed raised rates 525 basis points in about 16 months (March 2022 to July 2023), cumulative deposit beta for the median bank with $1 billion to $10 billion in assets came to about 42 percent on total deposits (March 2022 to the September 2024 peak in deposit costs), meaning deposit costs rose about 42 cents for every dollar of rate increase.
FFIEC Call Report Data: What It Contains and How to Use It
When the Fed raised rates 525 basis points in about 16 months (March 2022 to July 2023), cumulative deposit beta for the median bank with $1 billion to $10 billion in assets came to about 42 percent on total deposits (March 2022 to the September 2024 peak in deposit costs), meaning deposit costs rose about 42 cents for every dollar of rate increase. Many ALCO models going into the hiking cycle assumed faster pass-through. That gap explains why net interest margin held up better than expected through 2022 and into 2023, and it also explains why the compression that followed was sharper than boards anticipated once deposit repricing caught up. Every piece of that story, the margin expansion, the deposit cost trajectory, the eventual squeeze, sits inside the FFIEC Call Report, filed quarterly by every FDIC-insured commercial bank in the country.
The Call Report is the most granular public record of bank financial performance available. For community bank CFOs, treasurers, and chief credit officers, it is the primary data source behind ALCO packages, board capital updates, CAMELS assessments, and peer comparisons that show up in every strategic planning conversation. The data exists and it is public. The challenge is understanding what is in it, how it is organized, and how to get it into a format that is actually useful before the next ALCO meeting.

What Do the Call Report Schedules Actually Cover?
The Call Report (filed as FFIEC 031 for banks with foreign offices, FFIEC 041 for domestic-only banks below $100 billion in assets, and FFIEC 051 for smaller community institutions) runs across dozens of schedules covering every dimension of bank financial activity.
Schedule RC is the balance sheet. RC-C breaks down the loan and lease portfolio by category. RC-K carries quarterly averages for selected assets and liabilities. It has no capital item. RC-N is where examiners go first on credit quality; it reports past-due and nonaccrual loans by type, with 30-day, 90-day, and nonaccrual buckets reported separately. RC-R is the regulatory capital schedule, covering risk-weighted assets and each of the key capital ratios. RI is the income statement. RI-A reconciles retained earnings.
Each data element carries an MDRM code, a four-letter prefix followed by a four-character item number (usually four digits, but sometimes a letter and three digits, as in RCOAP793). The prefix identifies the reporting scope: RCFD covers consolidated domestic and foreign, RCON is domestic offices only, RIAD is for income statement items. So RCFD2170 is total consolidated assets. RIAD4074 is net interest income year-to-date. RCFD2122, or RCON2122 for FFIEC 041 and 051 filers, is total loans and leases net of unearned income. RCON1766 is commercial and industrial loans on the 041 and 051 (031 filers report RCFD1763 plus RCFD1764). These codes are how the Federal Reserve, FDIC, and OCC cross-reference every filed number, and they are the foundation of every peer comparison tool built on public Call Report data.
One note on prefixes before you pull anything. The same call report item carries a different prefix depending on which form the bank files. FFIEC 041 and 051 filers report RCON, for domestic offices. FFIEC 031 filers report RCFD on a consolidated basis, and RCFN for foreign offices, so total deposits for an 031 filer is RCON2200 plus RCFN2200 rather than RCON2200 alone. Schedule RC-R Part I (regulatory capital and the capital ratios) moved off RCON with the Basel III revisions of 2014 and 2015 and now uses RCOA on the 041 and 051 and RCFA on the 031; Part II (risk-weighted assets) still reports under RCON and RCFD. Query a single prefix and you will silently drop a whole population rather than get an error, and for an RCON-only query that population is the largest banks in the country.
The FFIEC’s published data dictionary maps each MDRM code to its schedule, line number, definition, and reporting requirements, and the official source is the FFIEC. In practice, most finance teams do not work directly with MDRM codes; they work with the ratios and benchmarks derived from them, which is where peer comparison platforms come in.
The Benchmarks That Drive ALCO and Board Conversations
The peer figures in this section describe $1B–$10B community banks as of early 2025.
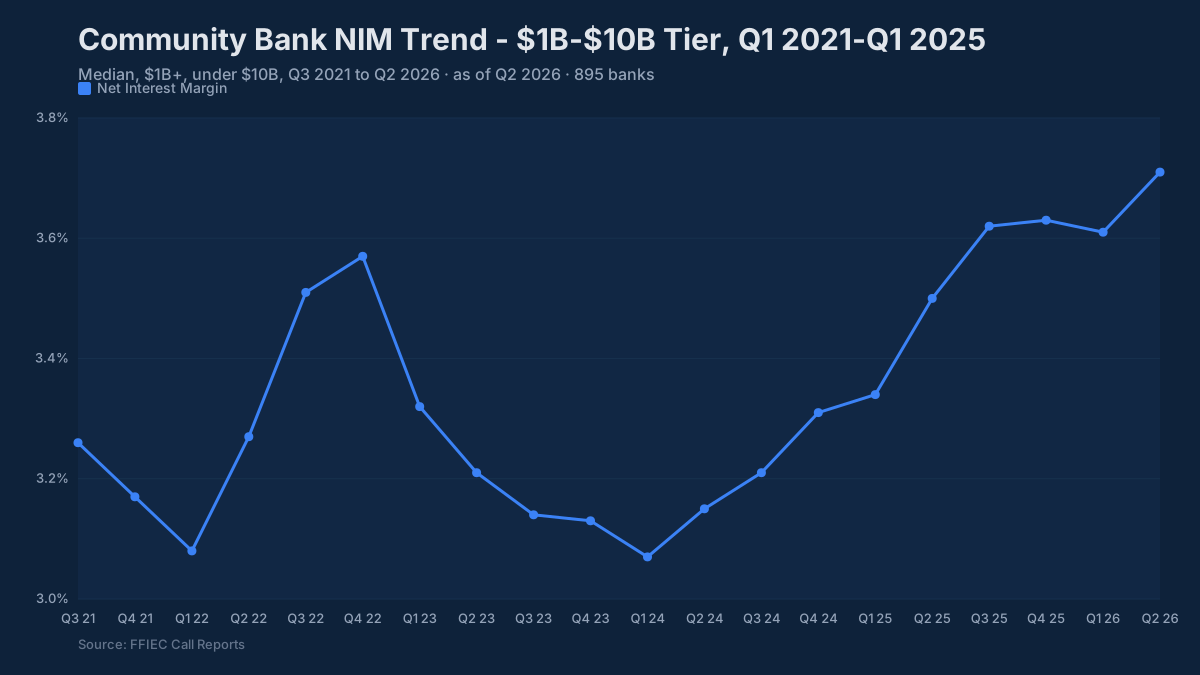
Net Interest Margin. The peer median for $1B–$10B community banks was 3.70% at June 30, 2026 (FDIC BankFind), up from 3.3–3.5% entering 2025. Top-quartile performers in this asset tier were above 4.1%, typically reflecting asset-sensitive balance sheets, strong loan pricing discipline, or core deposit franchises that limited deposit beta. Banks below 3.0% in this peer group are facing real pressure and usually need to address either earning asset mix, deposit cost structure, or both.
Efficiency Ratio. The median for community banks in the $1B–$10B range runs 60–65%. Below 60% signals operating discipline and leaves room to invest in technology or lending capacity without eroding the margin. Above 70%, boards start asking questions that do not have comfortable answers. Large banks typically run 55–60% on efficiency because of scale advantages; community banks that close the gap usually do it through revenue mix, not cost cutting alone.
Return on Assets. The peer median hovers at 0.95–1.10%. Strong institutions in this asset range clear 1.20%. Anything below 0.80% surfaces as an earnings quality concern during examination. Sustained ROA below 0.50% in a $1B–$10B institution is a capital generation problem: retained earnings are not accumulating fast enough to support loan growth without diluting capital ratios.
Capital. Community banks have historically run well above regulatory minimums, and that pattern continues. The median CET1 ratio for $1B–$10B institutions is approximately 13%, against the well-capitalized minimum of 6.5%. Tier 1 leverage sits around 10% at the median. The meaningful ALCO question usually is not whether you are well-capitalized; it is whether your capital trajectory supports your growth plan and absorbs the credit cycle without a rights offering or dividend cut.
Asset Quality: The Part Examiners Read First
Credit quality consumes more examination time than any other CAMELS component at most community banks. The benchmarks heading into 2025 reflect a credit cycle that normalized faster than many predicted after the stimulus-era dip in losses.
NPL ratios (noncurrent loans as a percentage of total loans) had a median of 0.51% for $1B–$10B institutions at June 30, 2026 (FDIC BankFind). A ratio above 2.0% puts a bank in a category that draws explicit examiner attention: questions about credit administration processes, loan workout staffing, and reserve adequacy follow. Heading into 2025, net charge-off rates were running about 0.15% to 0.20% annualized for community banks in aggregate, which is close to long-run historical norms after an unusually benign loss period from 2020 through 2022.
The allowance for credit losses, reshaped by the CECL transition, sits at roughly 1.1–1.4% of total loans for most community banks. The variation across institutions is significant because CECL reserves embed forward-looking economic assumptions: two banks with identical current delinquency levels can carry materially different reserves depending on their loan mix, geographic market, and model methodology. Examiners are spending considerable time on CECL model validation and the reasonableness of economic assumptions, particularly for banks with elevated CRE exposure.
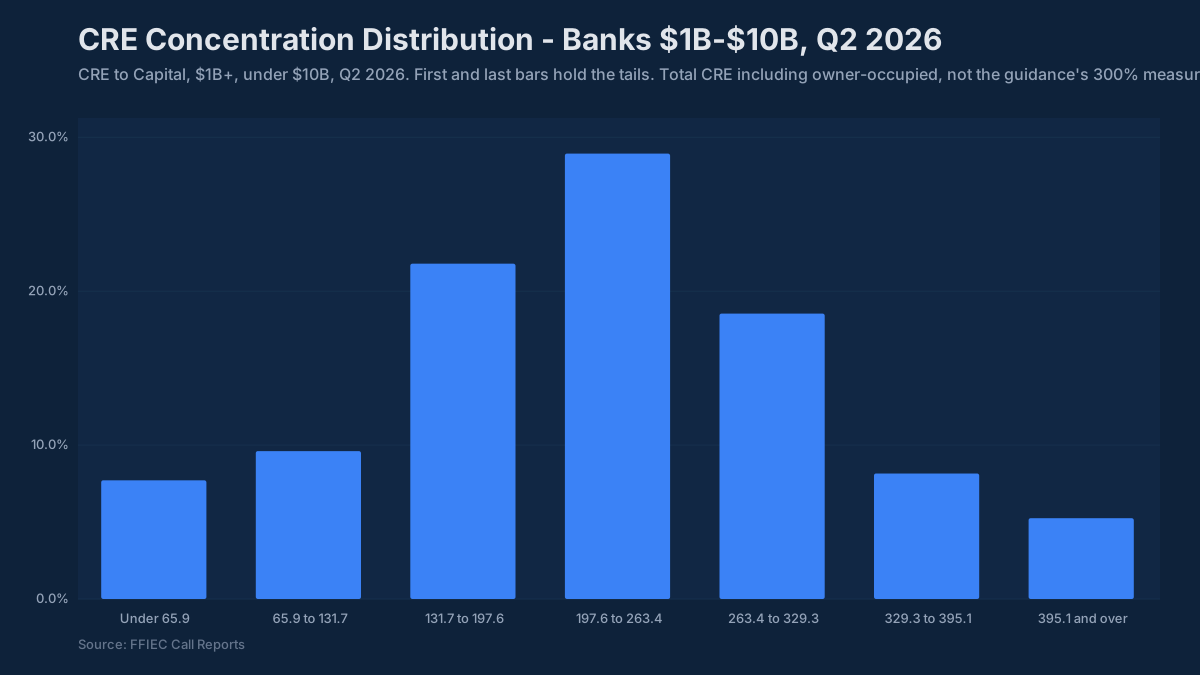
CRE concentration is the credit risk topic that has received the most sustained supervisory attention since the pandemic. The interagency guidance screens (total CRE at 300% of risk-based capital with growth of 50% or more over the prior 36 months, and construction and land development at 100%) are not limits; they identify banks for closer supervisory review and heightened risk management expectations. A bank at 280% is not automatically in trouble, but the examiner expects documented stress testing, board-level concentration limits, and a management information system capable of tracking concentration by subtype, geography, and borrower relationship.
Liquidity: The Metric That Moved Up the Agenda
Loan-to-deposit ratios got less attention during the low-rate era when deposits were abundant and cheap. The 2022–2023 hiking cycle changed that. Community banks in the $1B–$10B range typically run LDRs of roughly 85–90%. Above 90%, examiners start asking specific questions about contingent funding sources, wholesale borrowing capacity, and deposit concentration. A bank at 95% LDR with a heavy CD portfolio rolling at elevated rates faces a specific kind of refinancing risk that needs to be modeled explicitly in the ALCO interest rate risk framework.
Deposit composition has become the single most consequential variable in liquidity risk management. The difference between a core deposit franchise that stayed stable through 525 basis points of Fed hikes and a rate-sensitive book that required significant repricing is visible directly in the Call Report: in Schedule RC-E for deposit maturity and type, and in the deposit beta implied by the year-over-year change in interest expense relative to the rate move.
How to Actually Use Call Report Data for ALCO and Board Prep
The raw Call Report data is publicly available through the FFIEC’s Central Data Repository. Working with it directly requires matching MDRM codes to the data dictionary, reconciling amended filings, handling formatting changes across reporting periods, and building the peer group logic from scratch. For a community bank finance team already producing a monthly ALCO package, that infrastructure represents weeks of work to build and ongoing maintenance to keep current.
The BankRegReports platform handles all of that. You search for your institution by name or charter number, select a peer group by asset tier (or build a custom peer set with a free account), and pull the ratios you need (NIM, efficiency ratio, ROA, capital ratios, asset quality metrics, deposit composition) across multiple quarters. The data comes from the same FFIEC Call Report filings and UBPR publications that examiners reference, which means your peer percentile positioning on the platform is directly comparable to what shows up in examination materials.
On the Pro plan, export to Excel, and you have ALCO package inputs without rebuilding your existing template. The peer comparison data is particularly useful for the board capital and earnings discussion, where showing your institution against the peer distribution, not just a single benchmark, gives directors a clearer picture of relative performance.
What Deserves Attention Through the Rest of the Cycle
Credit normalization is the dominant theme. Office CRE is the category most community banks are watching even when they do not have direct downtown office exposure, because secondary effects on local market vacancy rates and property values are beginning to show up in smaller markets. Examiner focus on CRE stress testing will remain elevated, particularly for banks above the 300% concentration threshold.
NIM stabilization depends heavily on the rate path and each bank’s specific liability repricing calendar. Institutions that captured the rate cycle on the asset side (floating rate loans, short-duration loan portfolios repriced at higher rates) and held deposit costs through the cycle have a reasonable path back toward 3.5–3.7% margins. Banks with heavy fixed-rate loan portfolios or that used wholesale funding to fill deposit outflows face a different math.
The right preparation is running the scenario analysis now, with current Call Report data benchmarked against your peer group, before an examination cycle compresses the timeline. BankRegReports gives you peer data current through the most recent filed quarter, so the analysis reflects what examiners will see when they arrive.
The benchmarks and peer data referenced in this post are available through the BankRegReports platform, no data engineering required. Search any FDIC-insured bank, pull peer group comparisons, and, on the Pro plan, export to Excel for your ALCO package or board presentation.