Bank Regulatory Data Analysis: Getting More From Benchmarks
When the Fed moved 525 basis points in 18 months, deposit beta for community banks averaged roughly 40 percent, meaning for every dollar of rate increase, deposit costs rose about …
When the Fed moved 525 basis points in 18 months, deposit beta for community banks averaged roughly 40 percent, meaning for every dollar of rate increase, deposit costs rose about 40 cents. Most ALCO models had assumed 50 to 60 percent. That gap explains a great deal about why net interest margin held up better than expected through 2022 and into 2023 before compression finally arrived. Banks that had calibrated their repricing assumptions against actual peer behavior, rather than textbook betas, saw it coming. Banks running on generic assumptions got surprised when their models turned out to be wrong in the conservative direction.
That is the practical value of bank regulatory data analysis: not the data itself, but the calibration it allows. Done well, it tells you whether your institution is an outlier before the examiner does.
What Does Good Peer Benchmark Analysis Actually Look Like?
The FFIEC Call Report, the UBPR, and the FDIC institution database contain the most granular public financial disclosure available for any industry in the United States. Every federally insured bank files quarterly. Every filing is public. The official source is the FFIEC. The problem has never been availability; it has been the effort required to turn raw regulatory data into something a CFO can act on.
Start with the metrics that matter across four dimensions: earnings quality, asset quality, capital adequacy, and liquidity.
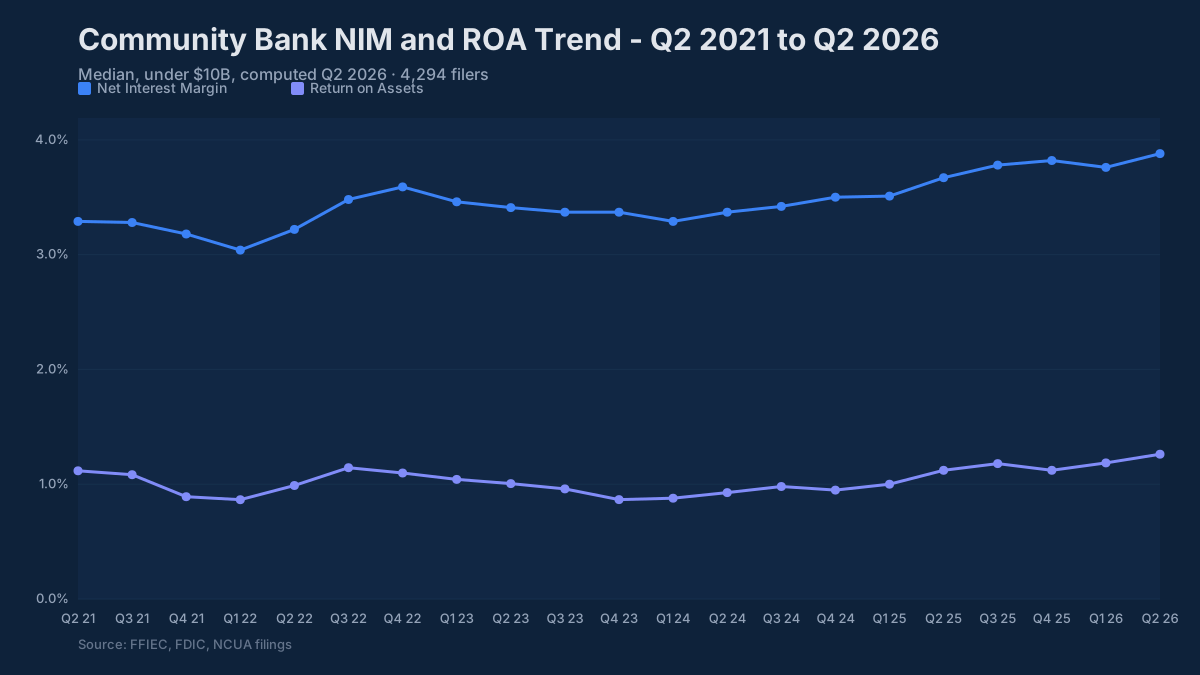
Net Interest Margin. Community bank NIM averaged roughly 3.3 to 3.5 percent as of Q1 2025. If your institution is running well above that range, the first question is loan mix: high concentrations in variable-rate CRE or C&I will explain it. If you are below 3.0 percent, the question is funding cost: are you holding excess deposits you cannot deploy, or are you paying up in a market where competitors have pulled back?
Return on Assets. A well-run community bank in a normal rate environment earns between 0.95 and 1.10 percent ROA. Institutions consistently above 1.20 percent are either in favorable markets, running lean, or both, and worth studying for your own cost structure. Below 0.80 percent warrants a board conversation about whether the earnings trajectory is structural or cyclical.
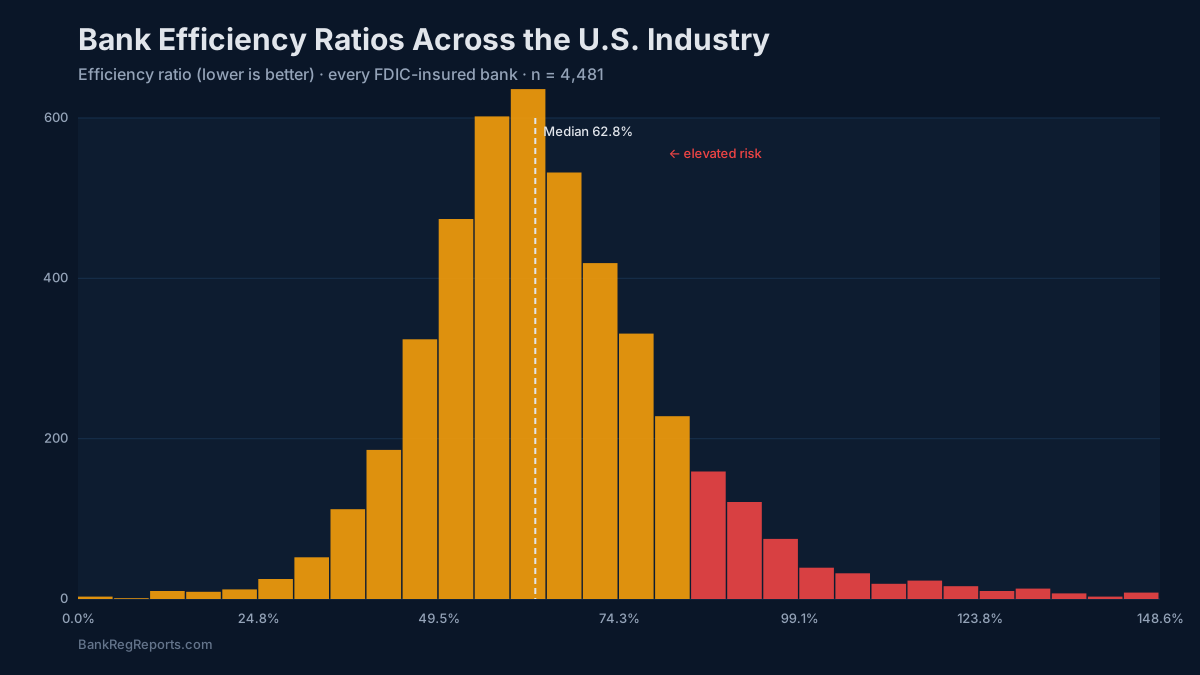
Efficiency Ratio. The 60 to 65 percent band is where most community banks operate. Below 60 percent is genuinely excellent and typically reflects either a high-fee business mix or an unusually low occupancy burden. Above 70 percent requires an explanation to the board that goes beyond “we are investing in growth”; examiners will ask whether the trajectory is improving, and they will want to see the plan.
Capital. The median CET1 ratio for community banks sits near 13 percent, well above the well-capitalized minimum of 6.5 percent. That buffer exists for a reason, and ALCO teams should be modeling what a severe credit cycle would do to it before the credit cycle arrives. Institutions running CET1 below 10 percent in a benign environment have less room than they may appreciate.
Asset Quality. Nonperforming loan ratios between 0.8 and 1.0 percent are typical in a stable credit environment. Once you cross 2.0 percent, examiner attention intensifies and you should expect focused questions on reserve adequacy. Net charge-off rates between 0.35 and 0.50 percent are normal; materially above 0.50 percent in a period without macro stress is a credit underwriting question worth answering internally before it becomes an examination finding.
Liquidity. Loan-to-deposit ratios in the 70 to 80 percent range give ALCO adequate operating flexibility. Above 90 percent, examiners will probe your contingency funding plan and your access to wholesale sources. That is not a red flag by itself, since some markets simply have strong loan demand and tight deposit supply, but the documentation and stress testing need to be proportionally stronger.
CRE Concentration. The interagency guidance screens for total CRE at 300 percent or more of risk-based capital combined with portfolio growth of 50 percent or more over the prior 36 months. It is not a limit. Institutions that meet it are not automatically in trouble, but they are subject to heightened scrutiny and should expect examiners to evaluate the granularity of portfolio monitoring, stress testing, and board-level oversight. If your construction and land development portfolio exceeds 100 percent of capital, that threshold carries independent weight.
What the Examiner Sees That Management Sometimes Misses
Examiners do not benchmark against the national median in isolation. They build a peer group (typically banks of similar asset size, charter type, and geographic footprint) and they compare your trajectory against that group’s trajectory. A declining NIM in a market where every peer is also declining reads differently than a declining NIM in a market where comparable institutions have stabilized.
The implication is that your ALCO package should reflect the same framing. If efficiency is rising, show whether peers are experiencing the same trend. If NPLs are flat while the broader peer group is deteriorating, make that explicit; it is a strength worth documenting for the board and for the examination. Conversely, if your metrics are holding steady while peers are improving, the examiner will notice even if management has not.
Board members, particularly audit and risk committee members, generally want to see two things: how the institution is performing against itself over time, and how it stacks up against peers. The first is straightforward trend analysis. The second requires reliable peer data, which is where most ALCO packages fall short, not because the analysis is wrong, but because the peer group selection was done once and never revisited.
Asset tier shifts matter. A bank that has grown from $700 million to $1.2 billion over five years is no longer a fair comparison to its original peer group. Keeping the peer set current is not a cosmetic issue; it affects what conclusions the data actually supports.
Building an ALCO Workflow Around Benchmark Data
The gap between having access to benchmark data and actually using it in ALCO decisions is largely a workflow problem. Data that requires a separate request to a vendor, a two-day turnaround, and manual reformatting before it reaches a spreadsheet tends not to get used for monthly decisions, only for quarterly packages, and even then under time pressure.
A more functional approach treats peer benchmarks as a standing component of the ALCO package, not an add-on. That means a consistent peer group, defined criteria for how that group is refreshed, and pre-built Excel outputs that drop into the existing template.
The BankRegReports platform is built specifically for this workflow. You search any FDIC-insured bank by name or charter number, define a peer group by asset tier and state or region, and pull the metrics that matter for your ALCO agenda: NIM, deposit beta, capital ratios, asset quality trends. On the Pro plan, the output exports to Excel with the structure your existing package expects. No data engineering, no vendor negotiation, no waiting for a relationship manager to run the report.
For institutions building out interest rate risk presentations, the deposit beta data is particularly useful. The 2022–2024 cycle produced the most significant rate shock in four decades, and institutions now have actual observed betas for peers rather than textbook estimates. Running your own assumptions against the realized distribution (not just the median, but the spread) is a materially better calibration exercise than anything available before 2022.
Where to Start
Pull your peer group on BankRegReports and run three comparisons before your next ALCO: NIM trajectory, efficiency trend, and NPL ratio relative to peers of similar size and footprint. If all three are in band and tracking with the peer direction, your next conversation can focus on strategy. If one is diverging, you want to know the reason before the examiner asks.
The institutions that will use the next rate cycle better than they used this one are the ones building calibration habits now, while the data is fresh and the cycle is still recent enough to study.
The benchmarks and peer data referenced in this post are available through the BankRegReports platform, no data engineering required. Search any FDIC-insured bank, pull peer group comparisons, and, on the Pro plan, export to Excel for your ALCO package or board presentation.