Community Banking Trends: What the Regulatory Data Shows
The 2022–2024 rate cycle is over, but its effects are still running through community bank balance sheets in ways that differ significantly from what you see in the headline industry …
The 2022–2024 rate cycle is over, but its effects are still running through community bank balance sheets in ways that differ significantly from what you see in the headline industry averages. At the $300M–$2B asset tier, the gap between institutions that managed through the cycle cleanly and those that are still working through compressed margins and book equity pressure is wider than it has been in a decade. That dispersion is exactly what peer comparison data is supposed to surface, when it is current enough to be useful.
Here is what the regulatory data actually shows.

The Rate Shock Hangover: Book Equity vs. Regulatory Capital
Pull RC-K and RI schedule data for banks in the $500M–$2B range and you find a cohort carrying negative or deeply suppressed tangible book values. This is not an insolvency signal for most of them. It is AOCI (accumulated other comprehensive income) working through unrealized losses on securities portfolios built during the zero-rate era. Most of these institutions elected the AOCI opt-out under Basel III, which means their CET1 ratios stayed in the 12–16% range even as GAAP equity compressed.
As of Q1 2025, the median CET1 for community banks was around 13%, well above the 6.5% well-capitalized threshold, and the typical Tier 1 leverage ratio sits near 10% against a 4% regulatory floor. But those aggregates obscure real variation. A bank carrying 250 basis points of unrealized securities losses and a Tier 1 leverage ratio of 8.5% is in a very different position than one at 11%, even if both clear the regulatory minimum comfortably. Examiners know this. They are looking at the composition of capital, not just the headline ratio.
The practical takeaway for your ALCO package: present regulatory capital ratios and GAAP book equity side by side, with a note on AOCI. Boards sometimes confuse suppressed book value with capital weakness. The data is your best tool for separating the two.
NIM Compression: Where Do Community Banks Actually Stand?
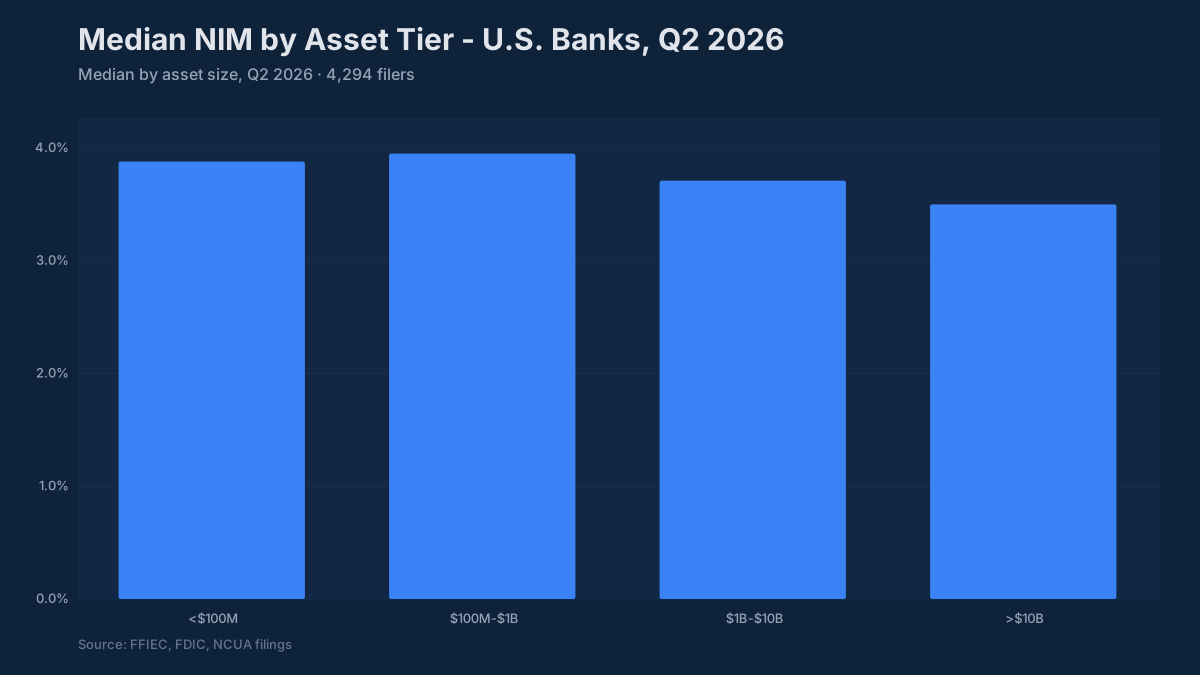
At March 31, 2025, the median NIM for $1B–$10B banks was 3.34%, with deposit costs having largely caught up to asset yields after the 2022–2024 rate cycle.
The deposit repricing lag is well understood in the abstract, but the institution-level variation is more instructive. Banks with lower brokered deposit concentrations (visible in the RC-E schedule) moved more slowly on deposit costs through 2022 and 2023, which helped NIM. Banks in more competitive urban markets repriced faster. Mutual savings institutions and thrifts showed a different pattern again, partly due to their liability structures.
As of early 2025 the repricing story was not over. Banks that funded their 2021–2022 loan growth with longer-maturity CDs or FHLB advances were still working through the liability side. The institutions best placed for NIM recovery were those where loan yields are resetting higher faster than remaining fixed-rate funding costs are rolling off. Your ALCO model should be tracking both legs of that trade explicitly, not just the aggregate NIM trend.
For context: an efficiency ratio in the 60–65% range is typical for community banks at this asset tier. Below 60% is genuinely strong. Above 70% draws board questions, and consistent readings above 75% tend to precede strategic conversations about expense structure or revenue mix that you want to be ahead of, not behind.
Deposit Beta: The Distribution Matters More Than the Average
Measured from March 31, 2022 to the September 30, 2024 peak in deposit costs, the median $1B–$10B bank’s cumulative deposit beta was about 42% on total deposits and about 53% on interest-bearing deposits; for banks of $100 million to $1 billion the figures were about 34% and 44% (BankRegReports analysis of Call Report data). Those medians are what circulate in ALCO presentations. What gets less attention is how much the distribution varies, and what drives the variation.
Banks with meaningful brokered deposit concentrations moved faster and higher. Institutions in markets with fewer than three significant deposit competitors moved slower. The 5300 Call Report data from NCUA tells a parallel story for credit unions in the same markets, and credit unions compete directly with community banks for retail deposits and consumer loans in most geographies. Watching their deposit cost trends is a legitimate competitive intelligence exercise, not an academic one.
The beta dispersion also reveals something about funding strategy quality. A bank that held deposit costs flat through mid-2022 by retaining strong core relationships, then saw betas accelerate in late 2022 as competition intensified, followed a very different path than one that repriced aggressively early and then moderated. Both might show similar cumulative betas, but the timing and concentration of that repricing has different implications for rate sensitivity going forward. Your ALCO model should track the beta trajectory, not just the endpoint.
CRE Concentration: Where the Exam Conversation Is Heading
The interagency guidance screens (total CRE at 300% of risk-based capital with growth of 50% or more over the prior 36 months, or construction and land at 100%) are criteria for closer review, not limits, and have been in place since 2006 and have not changed. What has changed is examiner attention. The combination of rising rates, slowing commercial real estate values, and office market distress at the national level has pushed CRE concentration back onto the supervisory agenda even for banks that have been managed within the guidance for years.
The RC-C schedule data shows a gradual but consistent reduction in CRE-to-capital ratios at institutions that were flagged as concentrated during the 2018–2020 exam cycle. The adjustment has been incremental (a gradual decline in CRE-to-capital over several years) rather than any dramatic deleveraging. That pace is consistent with what examiners have historically accepted as evidence of a credible management response.
For a bank currently sitting at 280–320% of RBC in CRE exposure, the conversation with examiners is not primarily about whether you cross the threshold. It is about whether you have a concentration management framework, stress testing, and board-level reporting that demonstrates active oversight. Banks that can show quarterly stress testing with specific loss scenarios tend to fare better in exams than those relying on the argument that their underwriting quality is sufficient.
Loan Quality: Normalization, Not Deterioration
The RC-N schedule is the first place to look for early credit stress, and as of Q1 2025 it told a story of normalization. The median noncurrent loan ratio for $1B–$10B banks was 0.43%. The 2020–2021 period, when forbearance and stimulus suppressed charge-offs to historically anomalous lows, looks like an outlier in retrospect. Net charge-offs at community banks ran 0.15% annualized in Q1 2025, matching the pre-pandemic average, per the FDIC Quarterly Banking Profile. The industry-wide rate was materially higher at 0.67%, reflecting credit card losses concentrated at the largest banks, so do not benchmark a community bank against the industry figure.
The nuance worth watching: the charge-off normalization is not evenly distributed across loan categories. Consumer auto and personal installment (categories that several community banks expanded into during the pandemic on favorable terms) showed the sharpest normalization. Allowance-to-loans ratios post-CECL transition were running 1.1–1.4% at most community banks as of Q1 2025, and the CECL modeling discipline has made those reserves somewhat more forward-looking than the incurred-loss reserves they replaced. But the adequacy of that allowance depends heavily on the granularity of your segmentation and the quality of your loss history data.
A ratio above 2.0% on NPLs draws heightened attention in credit committee conversations. Above 3.0%, examiners typically want to see a formal classified asset reduction plan. The Q1 2025 median was well below both thresholds for most community bank peer groups, but the trajectory matters as much as the level.
Getting Current Data Into Your ALCO Package
The analytical points above are only useful if you can pull current, institution-specific data quickly enough to act on them. FFIEC bulk downloads, UBPR files, and FDIC call data are all publicly available (the official source for the Call Report and UBPR is the FFIEC), but transforming them into peer comparisons takes time that most bank management teams do not have in the week before an ALCO meeting.
The BankRegReports platform pulls from all of these sources (FFIEC Call Reports, UBPR, FDIC, Federal Reserve Y-9C, NCUA 5300), standardized into a single interface. Search for your institution or any peer, pull the metrics discussed in this post, and export to Excel. The formula methodology is traceable to specific MDRM item codes, which matters when an examiner’s peer comparison does not match yours and you need to know why.
As of the Q1 2025 data, the credit cycle was normalizing, not breaking. NIM had recovered from its early-2024 low but was still below its 2019 level for most institutions. Capital was adequate across the peer group, with the important caveat that AOCI-related book equity distortion requires careful communication to boards. The institutions that will manage the next 12–18 months most effectively are the ones entering that period with current data, a clear view of where they stand in their peer group, and a board that understands the difference between GAAP equity and regulatory capital.
The benchmarks and peer data referenced in this post are available through the BankRegReports platform. No data engineering required. Search any FDIC-insured bank, pull peer group comparisons, and, on the Pro plan, export to Excel for your ALCO package or board presentation.