NCUA 5300 Call Report: A Credit Union Analyst's Guide
There are about 4,400 federally insured credit unions in the United States, and exactly zero of them file a bank call report. They file the **NCUA 5300 Call Report**, a …
There are about 4,400 federally insured credit unions in the United States, and exactly zero of them file a bank call report. They file the NCUA 5300 Call Report, a quarterly submission to the National Credit Union Administration. The data is public. The structure is familiar. The vocabulary will throw you if you are not expecting it.
For the short version, with who files and the quarterly due dates, see the NCUA 5300 Call Report explained. This is a working guide to the 5300: what it is, how it differs from the FFIEC 031/041/051 filings banks submit, what the capital framework actually means, and how to build a useful picture of a credit union from its filing history.
What the NCUA 5300 Call Report Actually Contains
The 5300 is credit unions’ quarterly filing capturing balance sheet, income statement, capital, loan delinquency, charge-offs, and membership data. Every federally insured credit union files through NCUA’s online portal each quarter. The data is aggregated, published, and freely downloadable from the NCUA’s call report data page.
The filing covers roughly the same analytical ground as Schedules RC, RI, RC-C, and RC-N on a bank call report. You get total assets, loan composition, share (deposit) structure, non-interest income, operating expenses, and capital. What you do not get is FFIEC standardization, MDRM item codes, or UBPR peer analytics; those are bank-specific infrastructure. The NCUA publishes its own Financial Performance Report (FPR), which serves a function similar to the UBPR but for credit unions.
One practical annoyance: 5300 item codes are not MDRM codes. If you are used to pulling RCON2170 for total assets or RIAD4107 for total interest income, there is a translation step. The NCUA’s data dictionary maps field names to definitions, but you are working with a different numbering convention entirely.
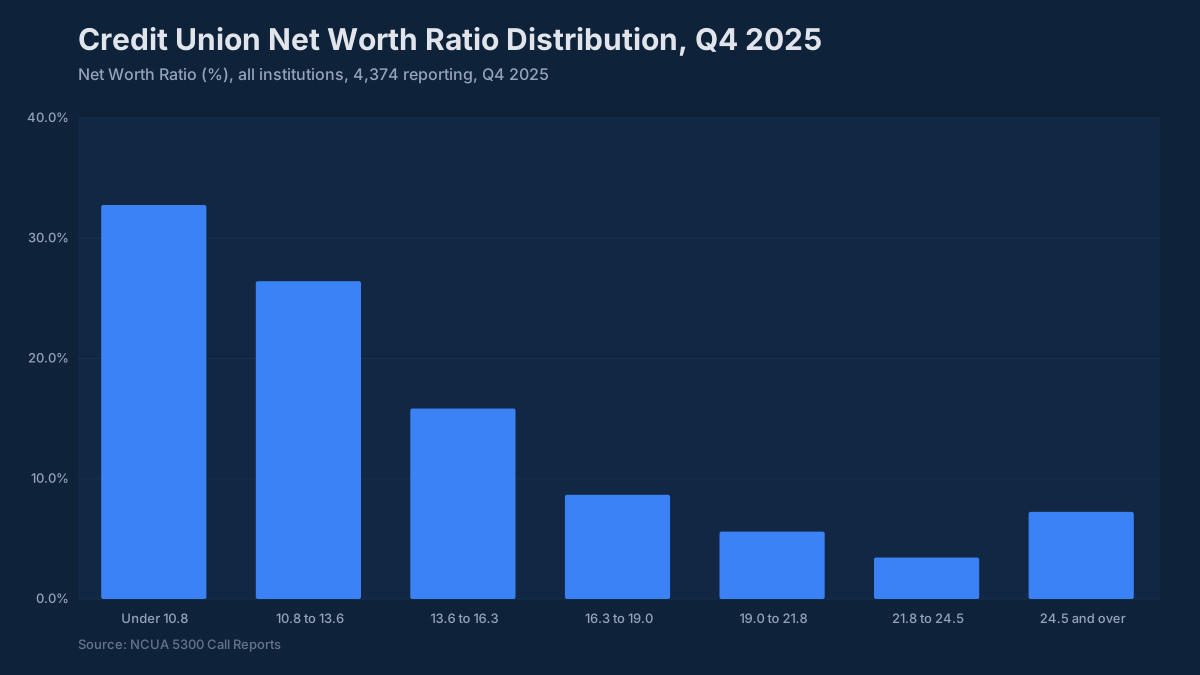
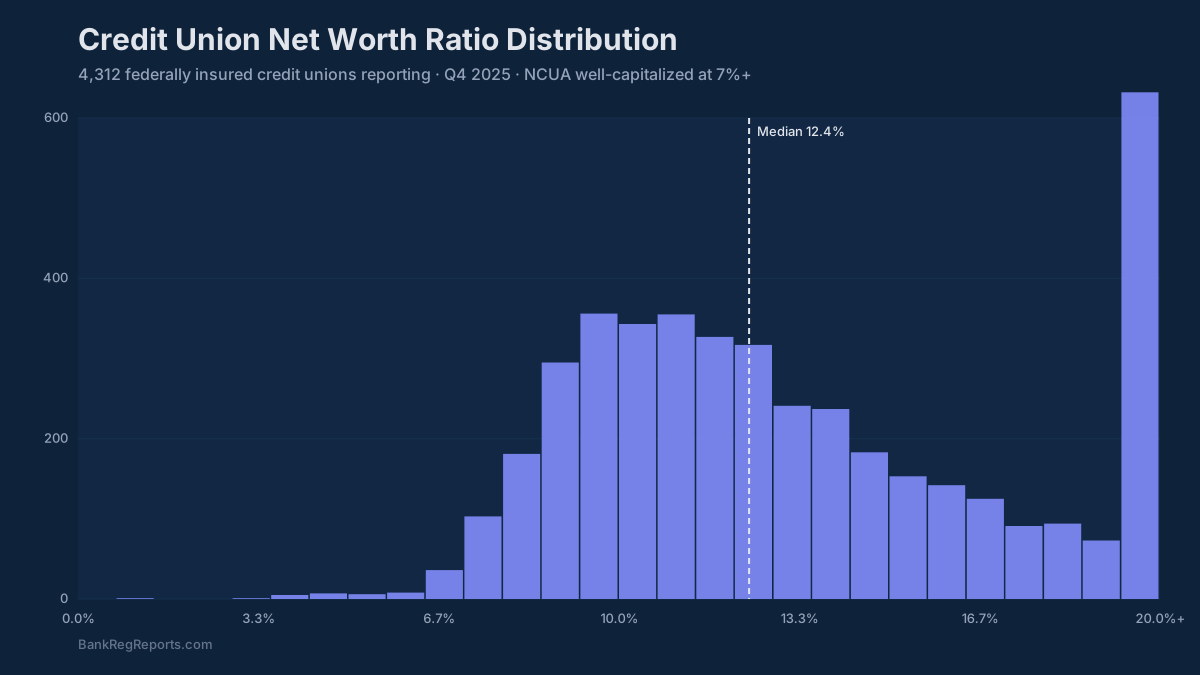
That distribution tells you something useful right away: the credit union system runs with substantially more capital cushion than the regulatory minimum. The median institution sits around 12.5% net worth ratio (the dollar-weighted system ratio is about 11.3%). That is not an accident; it is a structural feature of institutions that cannot issue equity and build capital almost entirely through retained earnings over decades.
How Credit Union Reporting Differs From Bank Reporting
The differences are not cosmetic. They affect how you read the filing and what you are actually measuring.
Regulator and insurer. Banks are supervised by the OCC, Federal Reserve, or FDIC depending on charter, and deposits are insured by the FDIC. Credit unions are supervised by the NCUA, and share deposits are insured by the National Credit Union Share Insurance Fund (NCUSIF), also administered by the NCUA. Same $250,000 per-member coverage limit, different fund, different regulator.
Ownership structure. Credit unions are not-for-profit, member-owned cooperatives. There are no shareholders. The people who deposit money are the owners. This shapes the capital framework, the tax treatment, and the strategic incentives of management. A credit union CEO answers to member-elected directors, not to equity investors with quarterly earnings expectations.
Tax status. Most credit unions are exempt from federal income tax. There is no provision for income taxes in the way you would see on a bank’s Schedule RI. Return on assets at a credit union is not comparable to a bank’s ROA on an after-tax basis without adjustment. An ROAA of 0.90% at a credit union and an ROAA of 0.90% at a community bank are not the same thing; the bank’s number is after-tax.
The vocabulary gap. This is where analysts get tripped up most often:
| Bank term | Credit union equivalent |
|---|---|
| Deposits | Shares / share deposits |
| Customers | Members |
| Shareholders’ equity | Net worth / members’ equity |
| Interest expense on deposits | Dividends to members on shares |
| Loan-to-deposit ratio | Loan-to-share ratio |
Once you map these, the balance sheet reads straightforwardly: assets funded by member shares (liabilities) and net worth (equity), income earned on loans and investments minus the cost of shares. The spread logic is identical to bank NIM analysis; you are calling the funding cost “dividends on shares” instead of “interest on deposits.”
The Net Worth Ratio: Capital Without Equity Issuance
This is the capital metric that matters for credit unions, and it works differently than bank capital ratios for one structural reason: credit unions cannot raise Tier 1 capital by issuing common stock.
Net Worth Ratio = Net Worth ÷ Total Assets
Their retained earnings accumulate quarter by quarter, year by year, and that accumulated surplus is all the capital they have. A credit union with a 14% net worth ratio has been profitable for a long time, or grew slowly enough that earnings kept pace with assets. Capital cannot be manufactured; it has to be earned.
Under the NCUA’s prompt corrective action framework, the thresholds are:
- Well capitalized: net worth ratio ≥ 7%
- Adequately capitalized: ≥ 6%, below 7%
- Undercapitalized: ≥ 4%, below 6%
- Significantly undercapitalized: ≥ 2%, below 4%
- Critically undercapitalized: below 2%
These are conceptually parallel to the leverage ratio PCA categories for banks, but the thresholds differ meaningfully. A bank at 7% Tier 1 leverage is comfortably well-capitalized with room to spare. A credit union at 7% net worth is right at the floor of well-capitalized. Context matters when comparing across institution types.
One additional wrinkle: complex credit unions, those over $500 million in assets, are subject to the NCUA’s risk-based capital rule, which took effect January 1, 2022, unless they elect the complex credit union leverage ratio (CCULR), which requires a net worth ratio of at least 10% (the requirement phased up from 9% in 2022 to 10% on January 1, 2024). For most credit unions filing the 5300, the net worth ratio is still the operative measure. But if you are analyzing a larger credit union, check whether the risk-based framework applies; the capital picture can look different under that lens.
Benchmarks That Matter: What the Numbers Should Look Like
Community bankers who work across institution types want concrete reference points. Here is where credit unions typically land, with the caveats noted above.
Net worth ratio: The median federally insured credit union runs at about 12.5%. Examiners start paying closer attention below 9%, and a declining trend is more concerning than a static number near the threshold. A credit union growing assets at 15% per year while earning 0.60% ROAA will erode its net worth ratio steadily; that trajectory is worth flagging early, not after it crosses 8%.
ROAA: Typical range is 0.70–1.00% for a reasonably well-run credit union. Remember the tax exemption adjustment. The rough pre-tax equivalent for a bank at 0.95% ROAA (assuming a 21% tax rate) is about 1.20%, so a credit union earning 0.95% ROAA is not performing as well as a bank earning 0.95% on a like-for-like basis, but it is also not taxed the same way. Boards and analysts should be clear about which comparison they are making.
Loan-to-share ratio: The middle half of credit unions runs between about 52% and 85% (median about 70%), with larger institutions running toward the higher end given their access to wholesale funding. A ratio above 90% means the credit union is funding loans through borrowings rather than member shares to a meaningful degree, fine in normal conditions, worth watching in a stress scenario.
Loan delinquency: Credit unions typically report delinquency at 60 days past due rather than the 30-day threshold common in bank metrics. Keep that in mind when comparing. A 60-day delinquency ratio of 0.60–0.80% is roughly in line with a healthy credit union portfolio. Above 1.5% warrants a look at the loan composition and underwriting standards.
Net charge-off rate: Similar to bank norms: 0.35–0.60% is typical for a credit union running consumer and auto portfolios. Credit cards, if the credit union offers them, can push this number higher. CRE portfolios tend to have lower NCO rates but can generate larger individual losses when they do occur.
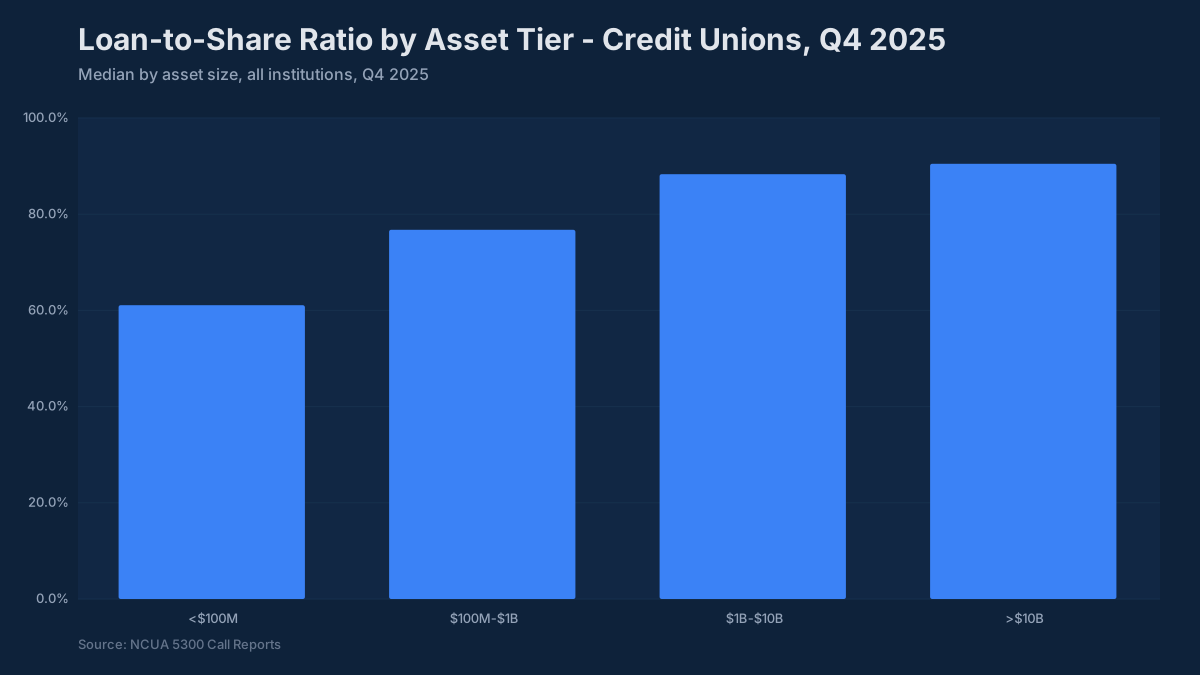
Larger credit unions carry higher loan-to-share ratios because they have access to FHLB advances and other wholesale funding that smaller institutions do not. A 79% loan-to-share ratio at a $5 billion credit union is a different risk profile than the same ratio at a $40 million community institution funded almost entirely by local member shares. Peer comparison within asset tier is not optional; it is the only comparison that means anything.
Analyzing a Credit Union From Its 5300 Data
The analytical framework maps directly from bank analysis. You are looking at the same five areas.
Capital anchors on the net worth ratio and its trajectory. A ratio declining 100–150 basis points per year is a signal worth understanding: is it rapid asset growth, deteriorating earnings, or both? A credit union that grew assets 20% last year while the net worth ratio fell 80 bp is not in crisis, but management should be able to explain the plan for capital restoration.
Asset quality is measured through the 60-day delinquency ratio and net charge-offs as a percentage of average loans. Also look at loan modifications to borrowers experiencing financial difficulty and whether they are growing; ASU 2022-02 eliminated the old troubled debt restructuring (TDR) category, but modifications like these can still obscure asset quality problems that have not yet migrated into charge-offs.
Earnings come down to ROAA and the net interest margin. Because there is no income tax, ROAA comparisons to banks need the adjustment noted above. NIM analysis works the same way: loan yield and investment yield on one side, dividend cost on shares and borrowing cost on the other. Credit unions that grew aggressively into long-duration fixed-rate mortgages in 2020–2021 are now experiencing the same NIM compression that hit community banks; their cost of shares has repriced faster than their asset book.
Liquidity and funding are assessed through the loan-to-share ratio and the composition of borrowed funds. Watch for heavy reliance on FHLB advances or corporate credit union borrowings as a percentage of assets; that reliance was manageable in the low-rate environment and has become more expensive.
Membership and growth are genuinely different from bank analysis. Membership data is in the 5300, and it matters. Membership growth drives share growth, which drives asset growth. A credit union losing members while growing assets is doing something worth investigating; often it means fewer, larger accounts, which changes the stability profile of the funding base.
BankRegReports pulls this data directly from NCUA 5300 filings, normalizes it across the full universe of federally insured credit unions, and puts any institution’s trend next to its peers.
Where the 5300 Falls Short
The 5300 is not as granular as a bank call report on several dimensions. Loan composition is less detailed than Schedule RC-C on the FFIEC 031: you get consumer, real estate, commercial, and a few other buckets, not the sub-schedules and detailed stratifications that bank examiners work through. Liquidity reporting is lighter. There is no direct analog to Schedule RC-N’s 90-day past due and nonaccrual breakdowns at the same granularity.
The NCUA’s Financial Performance Report fills some gaps, particularly on peer comparison. But if you are accustomed to the depth of UBPR analytics for banks, which the BankRegReports platform also covers, the credit union side is thinner in places. That is a data reality, not a criticism of the NCUA.
One area where the 5300 does give you useful data that bank call reports handle differently: membership counts and member business loan detail. If you are analyzing a credit union that has pushed into commercial lending, the MBL cap (currently the lesser of 1.75 times net worth or 12.25% of assets under federal law, with exemptions available) is worth tracking. A credit union approaching the cap has a constrained growth path in commercial unless it pursues an exemption.
Frequently Asked Questions
What is the NCUA 5300 Call Report? The NCUA 5300 Call Report is the quarterly financial and statistical filing that every federally insured credit union submits to the National Credit Union Administration. It captures balance sheet, income statement, capital, delinquency, and membership data, the foundation for NCUA supervision and public credit union analysis.
How is the credit union call report different from a bank call report? Both are standardized quarterly filings, but credit unions are not-for-profit member-owned cooperatives supervised by the NCUA and insured by the NCUSIF rather than the FDIC. Credit union reporting uses different terminology (shares instead of deposits, members instead of customers, net worth instead of shareholders’ equity), and capital is measured primarily through the net worth ratio rather than risk-weighted capital ratios. Credit unions are also generally tax-exempt, which affects how you interpret earnings metrics.
What is a good net worth ratio for a credit union? The median federally insured credit union runs at about 12.5% as of recent quarters. The regulatory floor for “well capitalized” is 7%. A ratio below 9% and declining is worth attention; below 7% triggers NCUA prompt corrective action. For growing credit unions, the trajectory of the ratio matters as much as the current level.
How does loan-to-share ratio compare to loan-to-deposit ratio? Functionally the same concept: loans as a percentage of the primary funding source. The typical range for credit unions is 65–80%, with larger institutions running higher given greater access to wholesale borrowings. Above 90% means the institution is funding loans through borrowed money rather than member shares to a significant degree.
Where can I find a credit union’s 5300 data? NCUA 5300 data is publicly available through the NCUA. BankRegReports presents credit union financials (net worth, asset quality, earnings, loan-to-share metrics) with historical trends and peer comparisons across the full filing universe, normalized within asset tier so you are comparing like institutions.
The data in this post is available through the BankRegReports platform. Pull peer benchmarks, Call Report metrics, UBPR trends, and enforcement history for any federally insured credit union or FDIC-insured bank, no data engineering required.