NCUA 5300 Call Report: A Practical Guide for Analysts
Net worth ratios across federally insured credit unions (NCUA 5300).

NCUA 5300 Call Report: A Practical Guide for Analysts and Credit Unions
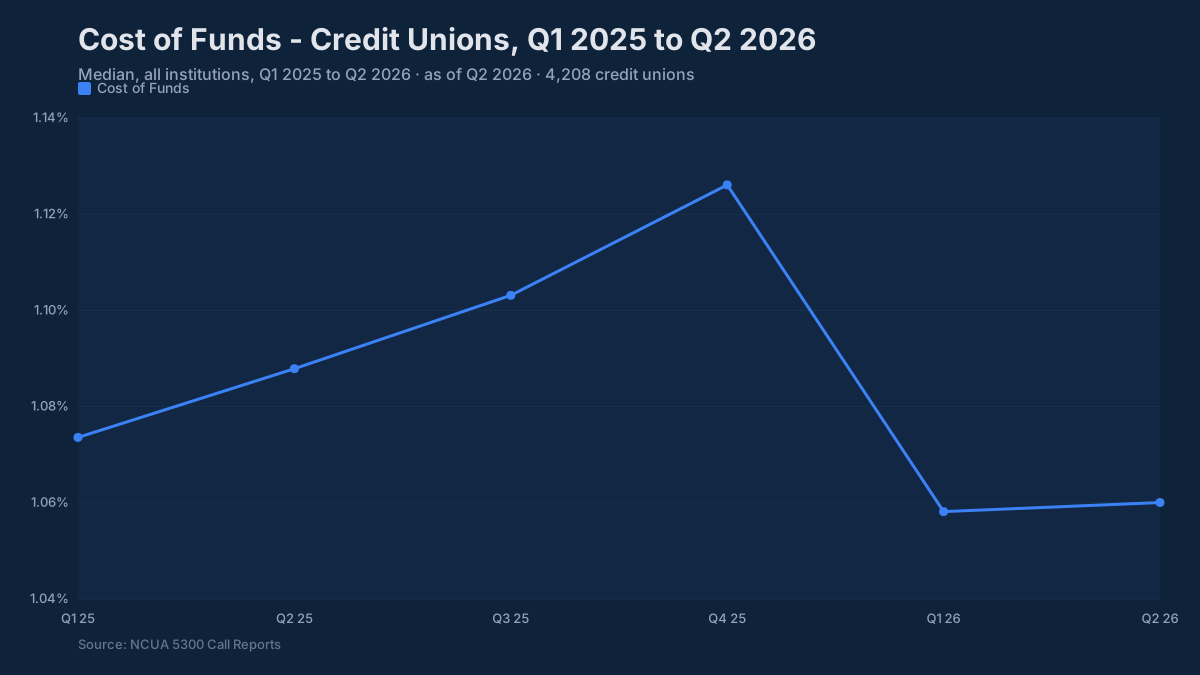
In the second quarter of 2023, the average cost of shares at credit unions with $1B–$10B in assets crossed 1.50%, roughly 40 basis points below what comparably sized community banks were paying on deposits at the same moment. By early 2025, that gap was still roughly 40 basis points, and some mid-size credit unions were outpricing regional banks on money market accounts by 30–50 basis points to defend membership. If your ALCO package does not include NCUA 5300 Call Report data, you are missing the filing that explains a meaningful share of the deposit competition in most markets.
The NCUA 5300 is the credit union equivalent of the bank Call Report. Every federally insured credit union files it quarterly. It covers the full balance sheet, income statement, loan quality schedules, share account detail, and net worth ratios, the same financial architecture your examiners use when evaluating your institution, applied to the roughly $2.4 trillion credit union sector. And unlike proprietary rate surveys, it is public regulatory data. The official source is NCUA.
What Does the NCUA 5300 Actually Contain?
The 5300 is not a simple capital adequacy filing. It runs across multiple schedules that together give a complete picture of a credit union’s financial condition.
Balance sheet schedules break loans into consumer categories (new and used auto, first mortgage, home equity, credit card, and member business loans) alongside share accounts, FHLB borrowings, and net worth. The granularity matters: a credit union reporting 35% of assets in used auto loans is running a different credit risk profile than one with 30% in first mortgages, even if the aggregate loan-to-share ratios look similar.
Income statement schedules report interest income by product type, cost of shares by account category, noninterest income (fee income, service charges, ancillary revenue), and operating expense detail broken into compensation, occupancy, and other buckets. For a bank ALCO team, the cost-of-shares-by-type data is the most immediately useful; it tells you what the credit union next door paid on money market shares and share certificates last quarter, with roughly a six-to-eight week lag after quarter-end.
Loan quality schedules report 60-day-plus delinquency and charge-offs by loan type. These are separate from the aggregate balance sheet, which means you can see whether elevated charge-offs are concentrated in auto (the sector’s current stress point) or spreading into mortgage and member business lending.
Capital and net worth schedules report the net worth ratio and, for complex credit unions over $500 million in assets, compliance with the NCUA’s risk-based capital rule, in effect since January 1, 2022, or with the complex credit union leverage ratio (CCULR) that a complex credit union can elect instead.
Membership and field-of-membership data indicate how broadly a credit union competes geographically. A credit union with a community charter covering your entire MSA competes differently than one restricted to a single employer group.
Key Benchmarks: Where the Sector Sits
For mid-size credit unions ($1B–$10B in assets) as of early 2025, the benchmarks break down as follows.
Net interest margin runs approximately 3.1–3.4%, modestly below the 3.3–3.5% range typical for comparably sized community banks. The gap reflects product mix more than pricing discipline. Credit unions hold heavier consumer and auto concentrations, which carry competitive market rates, while historically benefiting from lower deposit costs. During the 2022–2024 rate cycle, credit union NIMs compressed as share account costs rose, just later and more gradually than banks experienced.
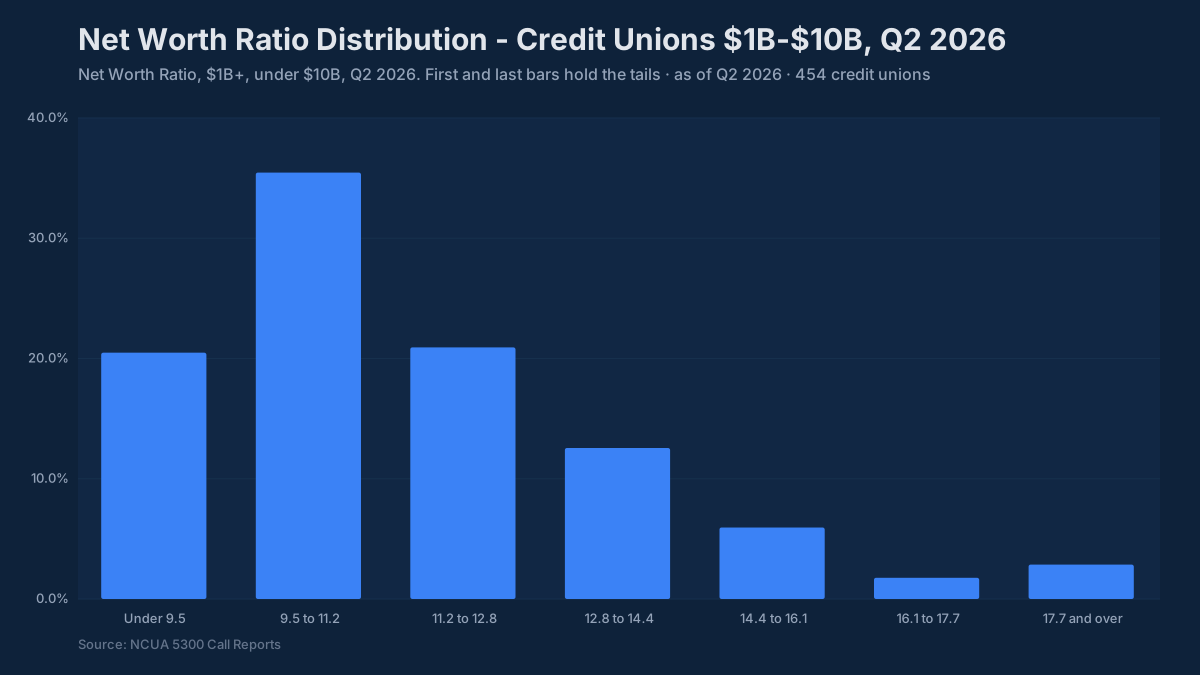
Net worth ratio (the primary capital metric under NCUA rules) sits at roughly 10–12% for well-managed institutions in this asset tier. The “well-capitalized” threshold is 7.0% net worth to total assets. Strong credit unions in the $1B–$10B range typically carry 11–13%, providing meaningful cushion above the minimum and room to grow loans without raising external capital. Anything below 7% triggers Prompt Corrective Action under the Federal Credit Union Act.
Efficiency ratio averages 75–82% for mid-size credit unions, well above the 60–65% range typical for community banks. The gap is partly structural. Credit unions return value to members through lower loan rates and higher dividends, which keeps net interest income down, and they typically earn less fee income than banks; both shrink the revenue denominator and inflate the efficiency ratio even when underlying expense control is sound. A credit union posting an efficiency ratio below 70% is demonstrating genuine operating discipline. One above 85% warrants questions about staffing levels and technology investment.
Loan-to-share ratio (the credit union analog of your loan-to-deposit ratio) typically runs 80–90% for mid-size institutions (median about 87% at March 31, 2025). NCUA examiners pay close attention when this climbs above the 85% to 90% range, applying the same liquidity adequacy scrutiny bank examiners apply to elevated loan-to-deposit ratios. The sector has been pushing this ratio higher since 2022 as share (deposit) growth slowed and loan demand, particularly in auto, held up.
Delinquency and charge-off rates have normalized after the unusually clean 2020–2021 period. A 60-day-plus delinquency rate of roughly 0.6% (median) was typical for mid-size credit unions as of early 2025. Annualized net charge-off rates run 0.50–0.75%, well above the 0.15% community bank norm, driven primarily by auto loan concentrations. Some credit unions with heavy used-auto exposure are reporting NCO rates on that product alone that are double pre-pandemic averages.
How the 5300 Differs from the FFIEC Call Report
The structural differences matter if you are trying to compare a credit union peer group against your own institution.
The most immediate difference is dollar denomination. Bank Call Reports express dollar amounts in thousands. The 5300 reports whole dollars, so a line showing $487,000,000 in member business loans means $487 million, not $487 billion. This trips up every analyst who crosses from bank data to credit union data for the first time.
Rate and ratio fields on the 5300 are frequently stored as integers scaled by 100. A reported yield of 625 means 6.25%. The FFIEC uses decimal representation for most rate fields. When you pull raw NCUA flat files and see a cost-of-funds figure that looks like 248, it means 2.48%, but nothing in the column header makes that obvious.
The capital framework differs meaningfully. Banks report CET1, Tier 1, and Total Capital ratios against risk-weighted assets. Credit unions report a net worth ratio (net worth divided by total assets) which is a simpler leverage-based measure. The 2022 NCUA risk-based capital rule added a risk-weighted layer for larger credit unions, but the net worth ratio remains the primary well-capitalized trigger. When a bank examiner and an NCUA examiner both say “capital looks comfortable,” they are measuring different things.
Field-of-membership reporting has no bank equivalent. Banks have geographic branching data in FDIC filings; credit unions have membership eligibility rules that determine who they can legally serve. A credit union converting from a single-employer to a community charter represents a competitive event that shows up in membership count trends well before it appears in balance sheet growth.
What Examiners Look For, and What It Means Strategically
NCUA uses the CAMELS rating system (Capital adequacy, Asset quality, Management, Earnings, Liquidity, and Sensitivity to market risk), the same framework bank examiners use. NCUA used CAMEL, without the S, until April 1, 2022, when it added the Sensitivity component to give interest rate risk its own rating.
On capital, the exam focus is the net worth ratio with hard attention below 8%. A credit union at 7.5% net worth is technically well-capitalized but will receive examiner scrutiny on capital planning, dividend (patronage) distributions, and loan growth projections. Below 7%, prompt corrective action begins with mandatory earnings retention (12 CFR 702.106); restrictions on asset growth start below 6% (12 CFR 702.107).
On asset quality, examiners track 60-day delinquency by loan type with particular focus on any category exceeding 1.5%. Auto loan quality has been the primary watchpoint since late 2022, and examiners have been requiring more granular vintage analysis from credit unions with heavy indirect auto concentrations.
On liquidity, the NCUA has become more assertive about loan-to-share ratios above 85% and borrowing dependency, the share of liabilities funded through FHLB advances and corporate credit union facilities versus core member share accounts. A credit union under NCUA liquidity pressure typically becomes a more aggressive deposit gatherer simultaneously with tightening loan underwriting. For a community bank in the same market, that combination shows up as more competitive share account pricing and less competitive loan pricing, which is worth knowing before your next ALCO pricing discussion.
ALCO Applications: Putting the 5300 Into Your Existing Workflow
The deposit pricing intelligence use case is the most immediate. Credit union cost-of-shares data by account type (money market shares, share certificates by term, regular shares) is the competitive pricing data your ALCO needs and currently may not have. A mid-size credit union in your market pricing 12-month share certificates at 4.60% when your CD rate is 4.25% is losing you depositors in real time, and the 5300 will show it one quarter later.
Member business lending schedules matter for credit officers evaluating shared borrowers. The 5300 shows outstanding MBL balances, concentration by collateral type, and charge-off experience. A credit union running 20% of assets in member business loans and reporting rising MBL delinquency is telling you something about credit underwriting standards in your shared commercial borrower base.
For strategic planning (branching analysis, M&A target evaluation, deposit market share modeling), the FDIC deposit market share data covers only banks. Including credit union share account data from the 5300 gives you a more complete picture of total deposit capacity in a market. In some suburban and rural markets, credit unions hold a large share of deposit-equivalent balances. An analysis that ignores them is missing part of the competitive picture.
The practical obstacle is data preparation. NCUA publishes raw flat files quarterly, but the unit conventions, schema changes across years, and amended filing tracking make the raw data difficult to use without preparation work. BankRegReports normalizes 5300 data alongside bank Call Report and UBPR data so you can search any credit union by name or charter number, pull peer comparisons across institution types, and, on the Pro plan, export directly to Excel.
The credit union sector is not a peripheral competitor in most community banking markets. With auto lending stress rising, member business lending expanding, and deposit pricing competition intensifying into a rate-cutting environment, the institutions filing 5300 data every quarter belong in your regular monitoring stack, reviewed alongside the FFIEC peer data you already use.
The benchmarks and peer data referenced in this post are available through the BankRegReports platform, no data engineering required. Search any FDIC-insured bank, pull peer group comparisons, and, on the Pro plan, export to Excel for your ALCO package or board presentation.