Credit Union Performance Analysis: Metrics and Benchmarks
NCUA data for Q1 2025 put the aggregate net worth ratio for federally insured credit unions at 10.95%, up from 10.61% a year earlier. That sounds comfortable until you look …
NCUA data for Q1 2025 put the aggregate net worth ratio for federally insured credit unions at 10.95%, up from 10.61% a year earlier. That sounds comfortable until you look at the institutions in the bottom quartile, where ratios have compressed into the 8–9% range while loan portfolios are repricing slower than share certificate costs. For a CFO or ALCO chair explaining capital trajectory to the supervisory committee, the aggregate number is the starting point, not the answer.
Credit union performance analysis lives and dies on peer comparison. A 2.6% NIM looks acceptable until you see that $500M–$1B asset-tier peers had a median of about 3.25% (March 31, 2025). A 0.8% delinquency rate is unremarkable industry-wide but alarming if your used auto concentration sits at 40% of loans and that segment is seeing the sharpest deterioration in a decade. The metrics that matter, the thresholds examiners use, and where community credit unions sat as of Q1 2025: that is what this post addresses.

Which Credit Union Performance Benchmarks Actually Matter for ALCO?
Net Worth Ratio: The Capital Floor and the Trend
The NCUA’s Prompt Corrective Action framework classifies credit unions by net worth ratio: well-capitalized at 7%, adequately capitalized at 6%, undercapitalized below that. Those are the floors. Examiners get interested well before you hit a regulatory trigger: a net worth ratio below 8% for a credit union carrying above-average loan growth or concentration risk draws a capital planning conversation in the exam, not just a line in the report. The median for $500M–$1B credit unions runs around 10–11%, with strong institutions holding 11–13%. Anything below 9% in that tier warrants a capital adequacy narrative in every board packet.
The ratio that generated the most examiner conversations in 2023–2024 was not the level but the direction. Credit unions that grew assets faster than 10% annually while holding net income flat were watching the ratio drift, not because of losses, but because denominator growth was outrunning earnings retention. A supervisory committee that only sees the current quarter ratio is missing the story.
Net Interest Margin: Compression, Recovery, and the Remaining Drag
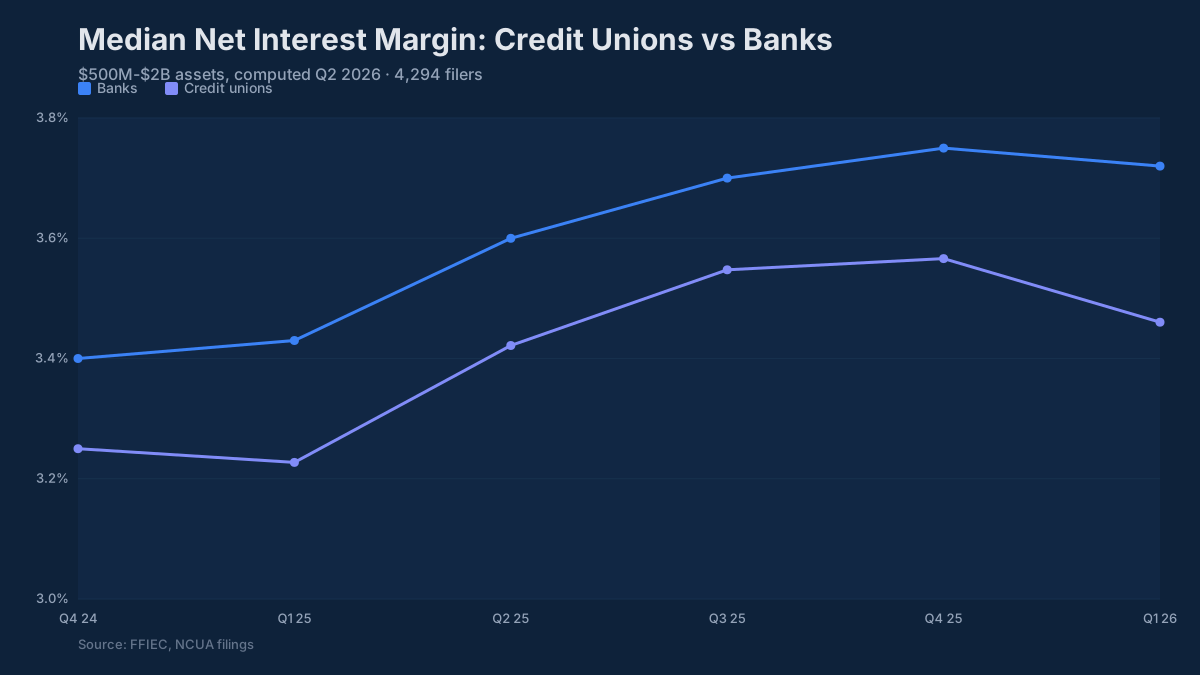
Credit union NIM compressed materially during the 2022–2024 tightening cycle for the same structural reason it compressed at community banks: loan portfolios repriced gradually while share certificate costs jumped almost immediately once the Fed started moving. For $500M–$1B credit unions, NIM peaked around 3.2–3.4% in mid-2022 before deposit repricing caught up. By Q4 2023, median NIM in that tier had pulled back to roughly 2.8–3.0%, and it has been in partial recovery as fixed-rate loans mature into higher-coupon replacements.
The spread between credit union NIM and community bank NIM narrowed during the cycle. Banks entered the tightening period with more variable-rate commercial loan exposure, which repriced faster. Credit unions, carrying heavier auto and real estate installment portfolios, lagged. Community banks in the $500M–$1B tier ran NIM in the 3.4–3.9% range at the peak before compression settled them back near 3.3–3.5% by Q1 2025. Credit unions in that tier ran only about 5 to 25 basis points below that band (median 3.25% at March 31, 2025), a persistent spread that reflects the structural difference in loan mix rather than operational weakness.
Loan-to-Share Ratio: Funding Concentration in Plain Sight
This is the credit union analog of the bank loan-to-deposit ratio, and it reads exactly the same way. A ratio in the 70–80% range signals a well-funded institution with liquidity headroom. Above 85–90%, NCUA examiners start asking about contingent liquidity sources: FHLB access, corporate credit union lines, Central Liquidity Facility membership. Above 95%, funding concentration risk is real and the exam’s Liquidity component of the CAMELS rating will reflect it.
The 2022–2024 period pushed loan-to-share ratios up materially across the industry. Credit unions that historically ran below 70% saw ratios climb into the 75–80% range as loan growth was strong and share inflows moderated when members moved funds to money market accounts and Treasury products. A handful of aggressive auto lenders crossed 90%. Those institutions spent much of 2024 managing back toward more defensible ratios through tighter origination standards and selective use of wholesale funding. The institutions that let the ratio drift past 90% without testing contingent lines were the ones receiving the most pointed liquidity questions in 2025 exams.
Delinquency and Charge-Off Trends: The Auto Credit Story
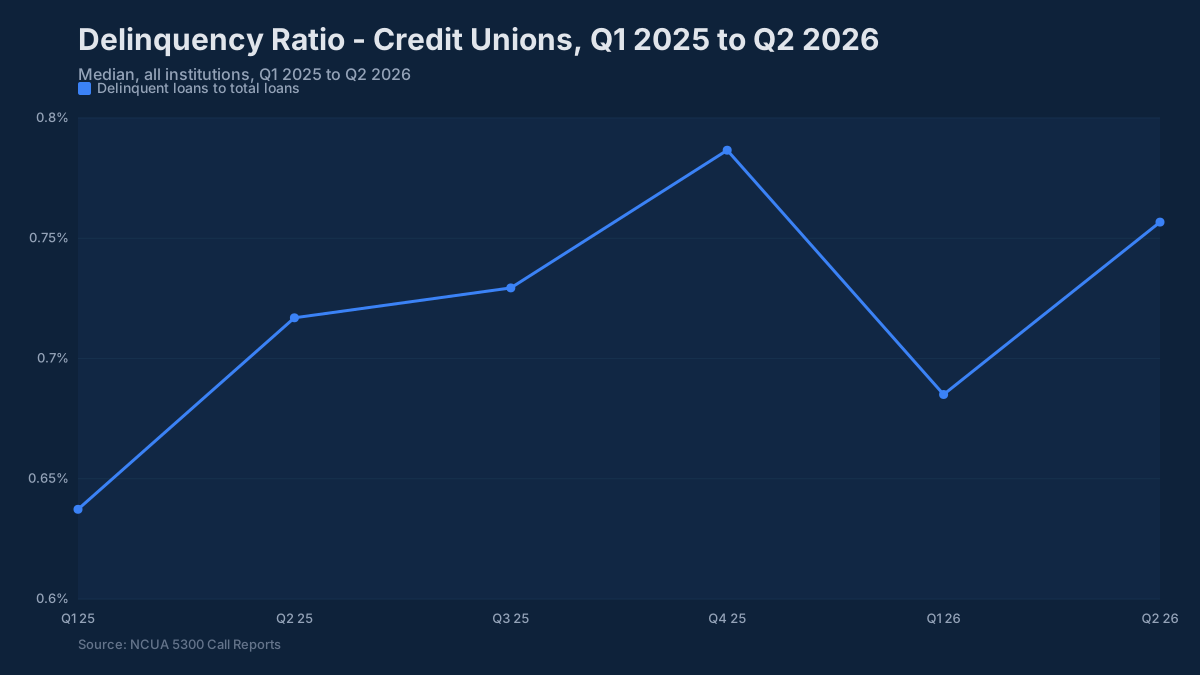
The asset quality story at credit unions in 2024–2025 is primarily an auto loan story, not a real estate story. Delinquency in used auto portfolios climbed sharply: 60-plus day delinquency in auto loans approached 1.0–1.2% by late 2024, against a historical norm closer to 0.5–0.7%. For credit unions with auto concentrations above 35–40% of total loans, that produced portfolio delinquency in the 0.9–1.2% range even with real estate and personal loan performance holding relatively steady.
The examiner threshold is not a hard number: context and trend matter, and NCUA examiners apply judgment based on portfolio mix. But a delinquency ratio above 1.0% combined with accelerating charge-offs typically produces an Asset Quality component rating of 3 or worse. Charge-off rates for $500M–$1B credit unions ran approximately 0.5–0.7% annualized through 2024, elevated from pre-pandemic norms of 0.3–0.5% but not yet at crisis levels. The institutions that underwrote to inflated used car book values in 2021–2022 are now seeing higher loss severity on defaults. The problem is not just higher frequency but higher dollars lost per event.
Operating Expense Ratio: Overhead Against Assets, Not Income
Credit unions report operating expense as a share of average assets, the equivalent of the bank efficiency ratio but structured differently. The industry norm for $500M–$1B institutions runs 2.8–3.2%. Below 2.5% signals a lean operation or low branch density. Above 3.5%, the supervisory committee and examiners will want to see either a credible plan to reduce the run rate or a clear revenue growth trajectory that can absorb the overhead load.
The rate cycle provided temporary relief here, though not in the ratio itself: the denominator is average assets, so higher interest income did not move it. What rising income did was make the same overhead easier to absorb, because earnings grew faster than most credit unions grew their overhead base. That cushion shrinks if rates decline and income compresses back toward pre-2022 levels while compensation and technology costs (both sticky) hold at current levels. Institutions that built out branch networks or launched digital transformation programs in 2021–2023 are now carrying the fixed-cost legacy of those decisions into a tighter margin environment.
For comparison, community banks in the same asset tier run efficiency ratios of 60–65% under the traditional bank calculation (noninterest expense divided by revenue). The different denominator makes direct comparison impractical, but the underlying dynamic is the same: overhead that grew during the good years becomes the primary earnings risk when revenue growth slows.
Deposit Beta and Funding Cost Trajectory
Cumulative deposit beta for credit unions through the 2022–2024 hike cycle averaged roughly 30–45%, lagging community banks (35–55%) by about 10 percentage points. That sounds like an advantage (lower funding cost passthrough), but it cuts both ways. Institutions that held share account rates low saw significant disintermediation, with members moving funds to money market products, brokered CDs, and direct Treasury purchases. Loan-to-share ratios climbed partly because the share balance base eroded underneath growing loan portfolios.
The more consequential number now is the trajectory of share certificate costs as existing CDs mature. Many credit unions locked in 12–18 month certificates at 2023–2024 peak rates; 4.5–5.0% was common in the competitive environment. As those mature through 2025–2026, the repricing question is how many basis points below peak members will accept at renewal versus shifting balances elsewhere. Institutions with strong relationship depth (high checking account penetration, direct deposit relationships, primary financial institution status) are in a better position to retain those balances at 50–100 basis points below the original certificate rate.
What NCUA Examiners Were Focused On in 2025
Since April 1, 2022 the NCUA has used CAMELS (Letter to Credit Unions 22-CU-05), the same six components as bank supervision, including Sensitivity to Market Risk. For a $500M–$1B credit union, the 2025 exam environment was concentrated in three specific areas.
Capital trajectory relative to asset growth is the first. Examiners are running forward projections: if loan growth continues at its current pace and earnings remain at their current level, what does the net worth ratio look like in four quarters? Any institution that cannot show a credible path to maintaining well-capitalized status will receive formal capital planning guidance and likely a requirement to submit a written plan.
Concentration risk in auto portfolios is the second. Examiners are asking for vintage analysis: not just delinquency but the performance of 2022 and 2023 originations specifically, when underwriting standards softened in a competitive environment and used car collateral values were at historic highs. Institutions that underwrote to inflated book values are now seeing loss severity that was not in their original models.
Liquidity and contingent funding is the third. The industry’s loan-to-share drift combined with share disintermediation created pockets of genuine funding stress in 2023. Examiners are now verifying that institutions have tested their contingent lines: actually drawn on FHLB advances or corporate credit union facilities, not just maintained them on paper. A line that has never been drawn is not a proven liquidity source in the examiner’s view.
Pulling Peer Data for ALCO and Board Packages
The NCUA 5300 call report data is publicly available each quarter from the official source, NCUA, but working with it directly requires managing schema changes, unit conversions, and field-name drift across filing periods. The BankRegReports platform normalizes NCUA 5300 data alongside FFIEC Call Report, UBPR, Federal Reserve NIC, and FDIC data into a consistent structure, so peer comparisons across asset tiers become a search and export rather than a manual reconciliation exercise.
For ALCO purposes: search your institution, select the relevant asset-tier peer group, pull the quarterly trend alongside the peer median and quartile distribution, and, on the Pro plan, export to Excel. The peer comparison framing that examiners use is reflected in the platform’s output: net worth ratio, loan-to-share, delinquency, and operating expense ratio are all available with peer context already built in. You can search any FDIC-insured bank or NCUA-chartered credit union at bankregreports.com without a separate subscription for each regulatory universe.
As of the Q1 2025 data, the forward challenge for $500M–$1B credit unions was a margin recovery story with execution risk on both sides. Loan portfolios will reprice higher as fixed-rate originations season out. But share certificate renewals, operating cost pressure, and continued softening in auto credit quality could absorb that income benefit before it flows through to capital. The institutions that manage that tradeoff well will do it with clear-eyed peer benchmarking against the metrics that actually move examiner ratings, and with ALCO packages built from current, normalized data rather than last quarter’s estimates.
The benchmarks and peer data referenced in this post are available through the BankRegReports platform, no data engineering required. Search any FDIC-insured bank, pull peer group comparisons, and, on the Pro plan, export to Excel for your ALCO package or board presentation.