Bank Liquidity Risk: Key Metrics and How to Monitor Them
Silicon Valley Bank's collapse unfolded in 48 hours. The balance sheet had looked reasonable on paper for quarters. The failure was not a credit event; it was a funding event, …
Silicon Valley Bank’s collapse unfolded in 48 hours. The balance sheet had looked reasonable on paper for quarters. The failure was not a credit event; it was a funding event, and the specific mechanism was an uninsured deposit concentration that turned a mark-to-market loss into a run. For community banks, the lesson is not that SVB’s situation was unique. It is that liquidity risk is the category where the static metrics most easily mislead you, and where examiner expectations have sharpened considerably since March 2023.
This post covers the core liquidity metrics your ALCO should track, what the benchmarks look like for $300M–$10B institutions, and where the regulatory tripwires are.

What Examiners Are Looking for in Liquidity, and What the Data Shows
The CAMELS “L” component evaluates three things: the adequacy of current liquidity, the quality of management’s monitoring and reporting, and the soundness of the contingency funding plan. Examiners expect to see a defined board-approved policy with quantitative limits, a trend analysis that goes back at least six to eight quarters, and documentation of contingency capacity (FHLB borrowing availability, unpledged securities, brokered deposit access) tested at least annually.
What has changed post-SVB is the depth of scrutiny on deposit composition. Examiners who previously might have glanced at the loan-to-deposit ratio and moved on are now asking specific questions about uninsured deposit concentration, large-depositor analysis, and the speed with which funding could leave under a stress scenario. That shift is visible in recent examination findings and in updated interagency guidance on liquidity risk management issued in 2023.
Loan-to-Deposit Ratio
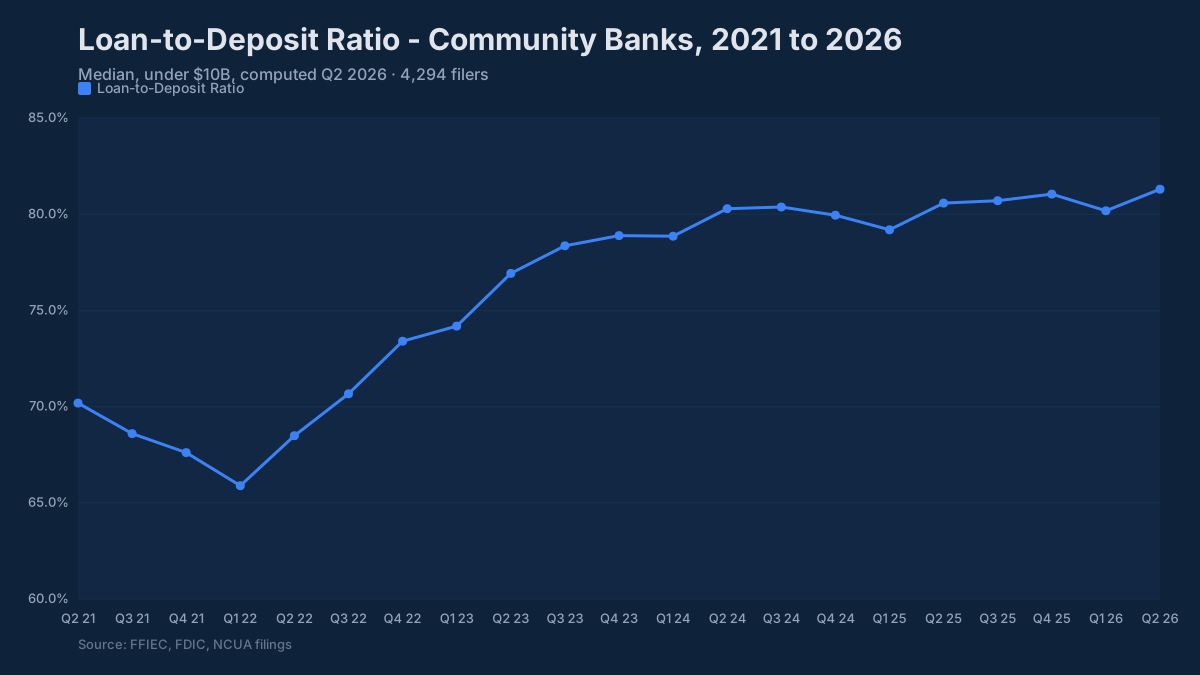
The median loan-to-deposit ratio for community banks in the $1B–$10B tier was approximately 87–89% entering 2025, having risen steadily from the liquidity-flush lows of 2021 (when excess deposits from stimulus kept ratios artificially compressed). A ratio in the 70–80% range is broadly comfortable. Above 90%, examiners start asking whether the bank is structurally dependent on non-core funding to support loan growth. Above 95%, expect a direct question in the exam report about funding strategy.
The ratio itself does not tell you the quality of the deposit base. A bank with an 80% LTD ratio funded by deep commercial operating relationships is in a fundamentally different position than a bank with the same ratio funded by rate-sensitive money-market accounts and CD specials.
Uninsured Deposit Concentration
Call Report Schedule RC-O captures estimated uninsured deposits (Memorandum item 2, reported by banks with $1 billion or more in assets), which allows you to compute the uninsured deposit ratio: uninsured deposits as a percentage of total deposits. Most community banks, particularly those with retail-focused deposit strategies, sit below 30%. Banks with significant commercial, municipal, or institutional depositors can run 40–60% or higher.
The SVB uninsured ratio was above 90%. That is an extreme. But the principle scales down: a community bank with a 45% uninsured ratio and a small number of large, networked depositors carries meaningfully more run risk than the aggregate ratio suggests. Examiners are now asking for large-depositor analysis: specifically, the top 10 or 20 depositors as a percentage of total deposits, and whether those relationships are operationally sticky or purely rate-driven.
If your institution sits above 40% uninsured, your contingency funding plan needs to explicitly address that exposure, and your ALCO policy limits should reflect it.
Core Deposit Ratio and Funding Mix
Core deposits, broadly understood as non-brokered retail and small business deposits, provide the stable funding base that supports a community bank’s balance sheet through rate cycles and stress scenarios. The UBPR defines core deposits consistently across filers, which makes peer comparison tractable. A core deposit ratio above 80% of total liabilities is strong. Below 65%, the bank is carrying meaningful wholesale funding reliance that warrants explanation.
Brokered deposits are not inherently a problem, but they carry two risks: they are rate-sensitive (you typically have to pay at or above market to attract them) and they may not be renewable if market conditions tighten or your institution’s condition deteriorates. The Brokered Deposits rule does restrict access for institutions below well-capitalized thresholds, which creates a pro-cyclical dynamic: the banks that most need the funding may be the ones that lose access to it.
FHLB advances are similarly double-edged. They are a legitimate and often economical funding tool, but an institution where FHLB advances represent 20%+ of total assets should be able to articulate, to its board and to examiners, what the runoff scenario looks like if that window narrows.
Deposit Beta and the Repricing Lesson From 2022–2024
Deposit beta measures how much of a rate increase gets passed through to depositors. A 50% cumulative beta over the 2022–2024 tightening cycle means the bank’s deposit costs rose roughly 260 basis points when the Fed Funds rate rose 525 basis points. Community banks as a group ran cumulative betas in the 35–55% range, lagged by roughly two quarters relative to market rates, meaning cost-of-funds pressure was still building in 2023 even as the Fed paused.
Banks with lower betas (say, 25–35%) held NIM better but often did so through a combination of relationship strength and geography rather than pricing strategy alone. The empirical data from the rate cycle is now available and should inform your NIM sensitivity models going forward. If your institution ran a 55%+ beta in the hike cycle, your ALCO model for the eventual cutting cycle needs to reflect the symmetry risk on the other side.
HQLA and On-Balance-Sheet Liquidity Buffer
The Liquidity Coverage Ratio is a formal regulatory requirement only for banking organizations with $100 billion or more in assets (and Category IV firms with less than $50 billion in weighted short-term wholesale funding are exempt), but the underlying concept applies at every size: how much could you fund without accessing new borrowing for 30 days under a stress scenario? The practical proxy for community banks is cash plus unencumbered, available-for-sale securities as a percentage of total assets.
A ratio of 15–25% provides meaningful buffer. Below 15%, particularly for institutions with higher uninsured deposit concentrations or above-average brokered funding, the margin for error narrows. Above 30%, the bank may be carrying excess liquidity that is a drag on NIM, a different kind of problem, but one your board should understand as deliberate rather than accidental.
The investment portfolio decisions made in 2020 and 2021 (when many community banks bought long-duration agency MBS at historically low yields) show up in this metric as unrealized losses that reduce the effective liquidity value of the AFS portfolio. Banks that bought significant duration in 2020–2021 may have securities that are available-for-sale in name but underwater enough that selling them generates capital pressure. That is a subtlety your examiner will probe.
Contingency Funding Capacity
Regulators expect your contingency funding plan to include not just a list of available sources but tested and quantified capacity. FHLB borrowing capacity should be confirmed with the FHLB, not estimated. Unpledged securities should be identified by CUSIP and checked against current haircut schedules. Brokered CD access should be verified with a broker, not assumed.
Banks that document $200 million in contingency capacity but have never actually tested the FHLB draw process, the brokered CD mechanics, or the Fed Discount Window eligibility are carrying operational risk on top of funding risk. Examiners have seen enough gaps between policy and practice in this area that they test documentation carefully.
How Do You Track These Metrics Over Time and Across Peers?
The most common ALCO gap in liquidity monitoring is treating these metrics as snapshots rather than trends. A loan-to-deposit ratio of 77% is unremarkable. A ratio that was 58% eighteen months ago, in an institution whose deposit growth has flattened while loan demand has stayed strong, is a trend that should be driving a conversation about the funding strategy.
Peer comparisons matter equally. If the $1B–$5B peer median is holding a 25% cash-and-securities buffer and your institution is at 14%, the gap warrants an explanation in the ALCO package, even if 14% is above any hard regulatory threshold.
The BankRegReports platform pulls Call Report and UBPR data across FDIC-insured institutions and organizes it by asset tier, peer group, and time series. The official source for that Call Report and UBPR data is the FFIEC. You can search your institution, pull the liquidity metrics above, and compare them against the peer distribution, no data pipeline required. The export goes to Excel, which is exactly where your ALCO template already lives.
A practical workflow: quarterly, pull your LTD ratio, uninsured deposit ratio, core deposit ratio, and cash-plus-securities buffer against the peer group median and 75th percentile. Flag anything that has moved more than 5 percentage points in a quarter or that sits outside the peer interquartile range. Those flags become the basis for the ALCO narrative, not the full story, but the right starting point for the conversation your board needs to have.
Examiners who arrive at a bank with a well-documented, trend-based, peer-contextualized liquidity monitoring process find it much harder to write a finding about inadequate monitoring. The data for that process exists and is updated quarterly. The main barrier is the extraction and normalization work, which BankRegReports handles so your team does not have to.
The benchmarks and peer data referenced in this post are available through the BankRegReports platform, no data engineering required. Search any FDIC-insured bank, pull peer group comparisons, and, on the Pro plan, export to Excel for your ALCO package or board presentation.