Comparing Credit Union and Bank Financials: What Changes
Your local credit union is competing directly for the same deposits and mortgage volume you are. In most community banking markets, one or two credit unions sit in the $500M–$3B …
Your local credit union is competing directly for the same deposits and mortgage volume you are. In most community banking markets, one or two credit unions sit in the $500M–$3B asset range and are actively pricing against you on 30-year mortgages and money market accounts. But when community bank ALCO teams pull peer benchmarks, they almost always compare against other banks. The credit union funding cost picture is invisible.
That gap in competitive intelligence is partly a data problem. Credit union and bank financial data come from entirely different regulatory regimes, with different line items, different capital frameworks, and, critically, some fields that look identical but measure different things. Before you can use credit union data in a competitive analysis or ALCO presentation, you need to understand where the comparisons hold and where they break. For the structural differences behind the numbers (ownership, charter, insurance and taxes), see credit union vs. bank.

The Regulatory Divide: Two Forms, Two Supervisors
Banks file the FFIEC Call Report (forms 031, 041, or 051 depending on charter and asset size). Bank holding companies file the Y-9C with the Federal Reserve. All of this flows through the FFIEC Central Data Repository and the National Information Center.
Credit unions file the NCUA 5300 Call Report directly with the National Credit Union Administration, which publishes it quarterly; the official source is NCUA. About 4,300 federally insured credit unions are active filers. There is no holding company analog for most of them.
These are not the same form with different headers. The definitions, the accounting treatment, and the supervisory intent differ in ways that matter when you try to stack the numbers side by side.
Capital: Net Worth Ratio vs. Risk-Based Capital
This is the comparison that breaks the most quietly. Banks operate under Basel III capital adequacy rules, and you know the numbers: CET1 ratio (median about 15% for banks under $10B, about 13.5% for $1B to $10B banks), Tier 1 leverage (median ~10%), and the well-capitalized thresholds of 6.5% CET1 and 5% leverage. Examiners focus hard on CET1 falling below 10% at community banks, and any institution approaching 8% is typically in active dialogue with its primary regulator.
Credit unions use a net worth ratio: total net worth divided by total assets. The NCUA “well-capitalized” threshold is 7%. That number sounds low relative to a community bank’s 13% CET1, but it is measuring something different: net worth here is the retained earnings analog, not a risk-weighted construct. Comparing these ratios directly overstates the apparent capital strength of a bank and understates the stability of a well-run credit union’s capital base.
The complexity increased in 2022 when the NCUA’s complex credit union rule brought a risk-based capital framework to credit unions above $500M in assets; a complex credit union can instead elect the complex credit union leverage ratio (CCULR), which has required a net worth ratio of at least 10% since January 1, 2024 (9% in 2022, 9.5% in 2023). If you are running a cross-sector peer analysis, you now have three capital metrics to track: bank CET1, credit union net worth ratio, and the NCUA risk-based capital ratio (or CCULR election) for larger credit unions. Map them separately. They cannot be averaged or compared as equivalent.
Funding Costs: Where Does the Competitive Edge Actually Live?
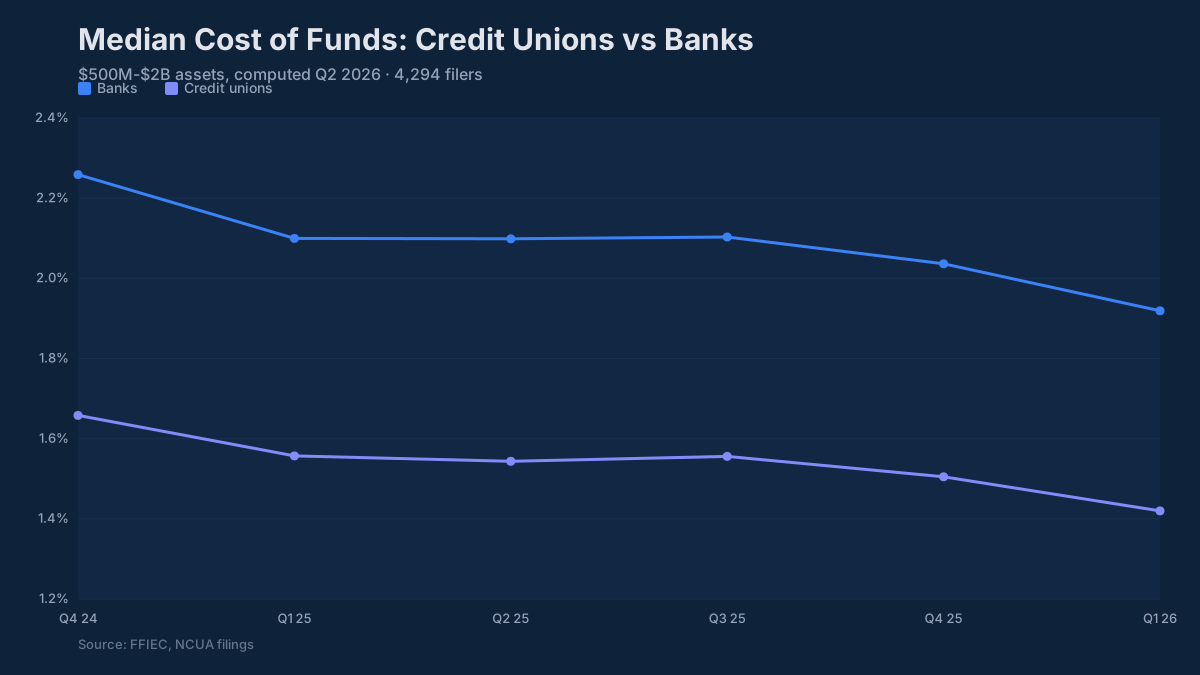
The deposit beta comparison during the 2022–2024 rate hike cycle is where ALCO teams have the most to learn from credit union data. Community banks in the $1B–$10B range had cumulative deposit betas of roughly 35–55% over that cycle, lagging Fed funds increases by about two quarters. Credit unions, on average, ran lower betas: their member deposit bases repriced more slowly, and their share of core member relationships provided a buffer that bank boards have increasingly asked about.
One wrinkle: credit unions have members, not depositors. Savings accounts are called shares. Certificates of deposit are share certificates. When you pull member business from NCUA 5300 data, you are pulling share data, not deposit data in the bank sense, even though the economic function is identical. The field naming difference trips up analysts building automated comparisons.
The efficiency ratio comparison is similarly tricky. A $1B credit union running a 72% efficiency ratio is not directly comparable to a community bank running 72%. The tax exemption is not the reason: income tax sits in neither the numerator nor the denominator of the ratio. The difference is in the definitions. The 5300 revenue line carries no tax-equivalent adjustment, credit union fee income is built differently, and member dividends on shares are a funding cost that compresses net revenue. Community banks in the $1B–$10B range typically run efficiency ratios between 60–65%. An efficiency ratio above 70% starts generating board questions. The credit union at 72% is likely running a structurally different cost base, not performing worse.
Loan Categories and the Member Business Loan Cap
Bank Call Reports use MDRM item codes across the RC-C schedule: commercial and industrial, construction, 1–4 family residential, consumer, and so on. Credit union 5300 data uses a different taxonomy. The categories overlap conceptually but not item-for-item, and direct mapping requires care.
The structural difference that matters most competitively: member business loans (MBLs) are the credit union analog of commercial and industrial loans. But under federal statute, most credit unions face a hard cap of 12.25% of total assets on MBLs. A $1B credit union can carry no more than roughly $122M in member business loans (less if its net worth ratio is below 7%, because the cap is the lesser of 1.75 times net worth or 12.25% of assets), however strong its underwriting. This constraint has no bank equivalent and shapes how credit unions compete in commercial real estate and business lending markets.
On CRE specifically: the interagency guidance screens (total CRE at 300% of risk-based capital with growth of 50% or more over the prior 36 months, and construction at 100% of RBC) apply to banks, not credit unions. They identify banks for closer review; they are not limits. Credit unions face different concentration guidance from the NCUA. When you see a credit union with apparently high CRE exposure, the relevant examiner framework is different from what you would apply to a bank peer.
Net interest margin for a typical credit union in the $500M–$3B range runs roughly 3.0–3.4%, modestly below the community bank median of 3.3–3.5% for $1B–$10B institutions as of Q1 2025. That spread narrowed during the rate cycle as credit unions’ lower deposit costs partially offset their lower-yielding, longer-duration loan portfolios.
What This Means for Your ALCO Package
The practical question is: how do you actually use this data? Most community bank ALCO teams are not going to build a cross-sector regulatory data pipeline. Nor should they. The value is in knowing how your local competitors’ funding costs and loan growth are tracking, information that belongs in the competitive section of your ALCO package alongside deposit pricing surveys and rate sheets.
A few specific uses for community bankers:
Deposit pricing context. When you are deciding how aggressively to hold or cut your money market rate, knowing that the two credit unions in your market are running 40 bp lower on member shares is real intelligence, not a curiosity. That gap tells you something about their deposit stickiness and your pricing room.
Mortgage market share. Credit unions have taken mortgage market share steadily over the past decade. Their loan-to-share ratios (the functional equivalent of your loan-to-deposit ratio, which runs 70–80% at typical community banks) tell you how much balance sheet capacity they have to grow loan volume aggressively into a given rate environment.
Strategic planning and M&A context. Credit union conversions to mutual savings banks, and more recently to stock-form institutions, have created acquisition opportunities in some markets. Understanding a target credit union’s capital adequacy under both the NCUA net worth framework and a pro-forma bank capital framework is essential to any deal analysis.
You can pull both bank and credit union benchmarks directly from the BankRegReports platform, which ingests FFIEC Call Reports, NCUA 5300 data, FDIC institutions data, Federal Reserve NIC, and UBPR into a single environment. Search your market, pull a peer group that includes both bank and credit union competitors, and export to Excel for your ALCO template.
One note worth mentioning for teams that do build automated workflows: BankRegReports exposes all of this data through an API as well, with consistent field naming across both regulatory sources. For analysts building recurring competitive monitoring reports, that consistency across the NCUA 5300 and FFIEC Call Report data is the hard part, and the platform handles it so you are not maintaining two separate field mapping tables.
The credit unions in your market are already in the room at deposit pricing time. The question is whether you are looking at their numbers when you set yours.
The benchmarks and peer data referenced in this post are available through the BankRegReports platform, no data engineering required. Search any FDIC-insured bank or NCUA-insured credit union, pull peer group comparisons, and, on the Pro plan, export to Excel for your ALCO package or board presentation.