CET1 Capital Ratio: What It Means and How to Pull It
If you have sat through a bank regulatory exam, built a capital stress model, or tried to benchmark a community bank's capital position against peers, you already know that CET1 …
If you have sat through a bank regulatory exam, built a capital stress model, or tried to benchmark a community bank’s capital position against peers, you already know that CET1 is the number everyone in the room cares about most. It is the purest measure of a bank’s loss-absorbing capacity: no hybrid instruments, no goodwill padding, no tier-2 cushion. Just common equity standing between depositors and a bad outcome.
What Does CET1 Capital Actually Measure?
Common Equity Tier 1 capital is defined under the Basel III framework, implemented in the United States through the capital rules of the three banking agencies (12 CFR Part 3 for national banks and federal savings associations, 12 CFR Part 217 for state member banks and bank holding companies, and 12 CFR Part 324 for state nonmember banks). The numerator is the most restrictive definition of capital regulators have ever codified: common stock and related surplus, retained earnings, accumulated other comprehensive income (AOCI), and a small set of other qualifying instruments, minus a list of regulatory deductions that includes goodwill, other intangibles, deferred tax assets above a threshold, and certain investments in unconsolidated financial institutions.
The denominator is risk-weighted assets (RWA): the bank’s on- and off-balance-sheet exposures each assigned a risk weight, from 0% for U.S. Treasuries to 100% or higher for C&I loans and some structured products.
The result is a ratio that stress-testers, analysts, and examiners treat as the line between a going concern and a gone concern.
The Regulatory Minimums
Under Basel III as adopted in the U.S.:
- Minimum CET1: 4.5% of RWA
- Capital Conservation Buffer: 2.5% on top, bringing CET1 to the 7.0% a bank needs to avoid limits on dividends and discretionary bonuses (the prompt corrective action well-capitalized level is 6.5%)
- G-SIB Surcharge: Additional buffers for globally systemic institutions, ranging from 1.0% to 4.5%
- Stress Capital Buffer (SCB): For Category I–IV firms, the SCB replaces the static conservation buffer with a firm-specific buffer derived from the Fed’s annual stress test
Community and regional banks operating below $100B in total assets face the 4.5% floor plus the 2.5% conservation buffer. Being well-capitalized under PCA (Prompt Corrective Action) requires 6.5% CET1. Most well-run community banks manage to 10–12% or higher, which creates meaningful excess capital capacity, but also raises questions about earnings drag on equity.
Why AOCI Treatment Matters
One subtlety that came back into focus during the 2022–2024 rate cycle: banks that are not subject to the advanced-approaches capital rules, broadly firms outside the largest, most systemic tiers (Category I–II under the tailoring framework), were permitted to make a one-time election to opt out of including most AOCI in regulatory capital. That means unrealized losses on available-for-sale securities, which exploded as rates rose, do not flow into CET1 for those institutions. This is exactly why you saw banks with reported CET1 ratios of 11% that had tangible book values approaching zero or negative on a mark-to-market basis. The ratio was technically correct; it just was not telling the whole story. Understanding this opt-out is essential context whenever you are pulling CET1 data and comparing across institutions.
Where the Data Lives in Regulatory Filings
CET1 is reported by commercial banks and savings institutions on the FFIEC Call Report (forms FFIEC 031 and FFIEC 041/051), whose official source is the FFIEC. For bank holding companies, the equivalent filing is the Federal Reserve Y-9C. Credit unions report capital under a parallel but distinct framework on the NCUA 5300 Call Report: they have a net worth ratio, not CET1, though the concept maps roughly.
The specific MDRM codes for CET1 on the Call Report are in Schedule RC-R (Regulatory Capital). The key items:
- RCOAP793 on the FFIEC 041 and 051, RCFAP793 on the 031: Common Equity Tier 1 capital ratio, Schedule RC-R Part I item 49
- RCOAA223 / RCFAA223: Total risk-weighted assets, the denominator, item 48
- RCOA7205 / RCFA7205: Total risk-based capital ratio, item 51; RCOA7204 / RCFA7204: Tier 1 leverage ratio, item 31
One note on prefixes before you pull anything. The same call report item carries a different prefix depending on which form the bank files. FFIEC 041 and 051 filers report RCON, for domestic offices. FFIEC 031 filers report RCFD on a consolidated basis, and RCFN for foreign offices, so total deposits for an 031 filer is RCON2200 plus RCFN2200 rather than RCON2200 alone. Schedule RC-R Part I (regulatory capital and the capital ratios) moved off RCON with the Basel III revisions of 2014 and 2015 and now uses RCOA on the 041 and 051 and RCFA on the 031; Part II (risk-weighted assets) still reports under RCON and RCFD. Query a single prefix and you will silently drop a whole population rather than get an error, and for an RCON-only query that population is the largest banks in the country.
If you have ever tried to work directly with the FFIEC bulk download files, you know the pain: multiple ZIP archives per quarter, inconsistent column naming across form vintages, bank identifier crosswalk between CERT, RSSD, and LEI, and the ever-present problem of units: are these thousands or whole dollars? The raw data is public, but it is not clean.
Practical Use Cases
Credit analysis and underwriting: Before extending correspondent credit lines or purchasing bank debt, you want time-series CET1 alongside the trend in RWA composition. Declining CET1 driven by RWA growth is a different risk story than declining CET1 driven by capital distributions.
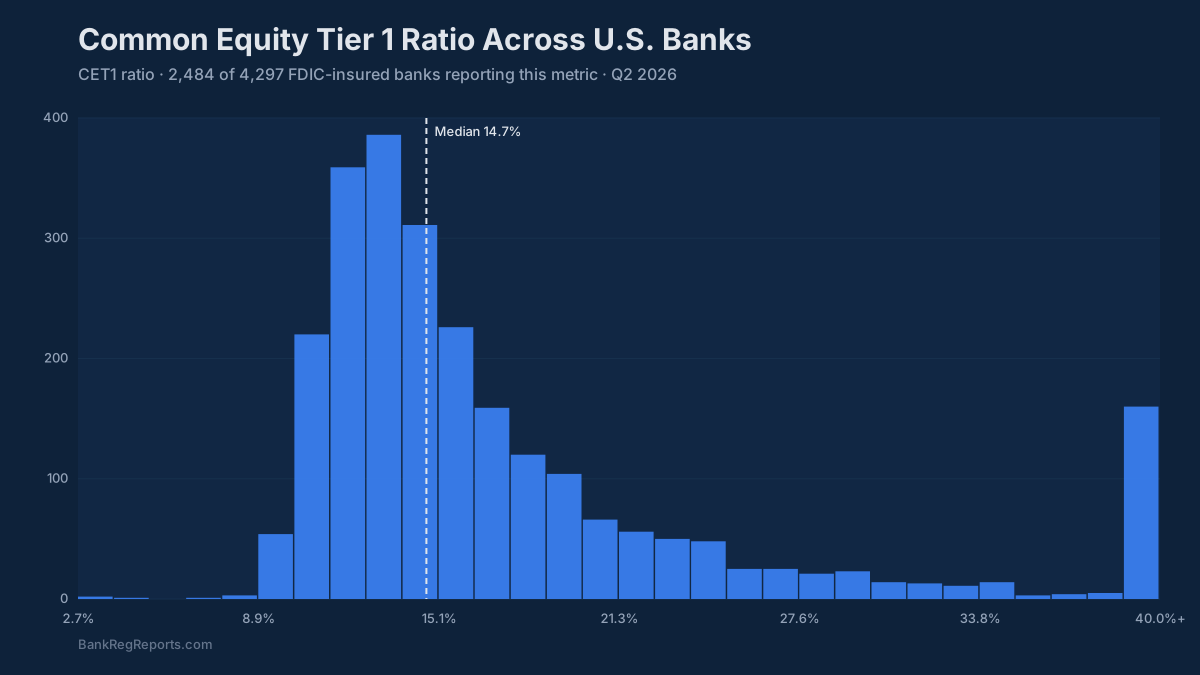
ALCO benchmarking: If you run or support an ALCO, you need to know where your institution sits in the peer distribution on CET1, and how that has moved over the last six to eight quarters. Regulators notice when you drift below peer median without explanation.
Regulatory exam preparation: Examiners pull peer comparison data. Knowing what they are going to see before they walk in the door (and being able to explain divergences) is part of good exam management.
Stress testing and capital planning: A clean, normalized history of CET1 is the foundation of any capital stress model. You need quarterly time series, you need RWA components, and you need it for hundreds of institutions if you are doing a macro scenario analysis.
A Note on Data Quality
CET1 data from raw regulatory filings has known quality issues: late amendments, restatements, missing values for banks in de novo periods, and the occasional mis-filing that the FFIEC corrects in a subsequent quarter.
BankRegReports also surfaces FDIC institution data and Federal Reserve NIC entity hierarchy data, which means you can resolve the bank-to-holdco mapping cleanly, something that is surprisingly painful if you are trying to do it from raw RSSD crosswalk files.
Get Started
If you are building capital analytics, doing peer benchmarking, running stress models, or just trying to answer “where does this bank stand on CET1 relative to peers” without spending a day in Excel against FFIEC bulk files, BankRegReports is built for that use case.
Every figure described here comes from Schedule RC-R of the quarterly call report, standardized and presented against peer groups.