Interest Rate Risk: Key Metrics and Regulatory Data
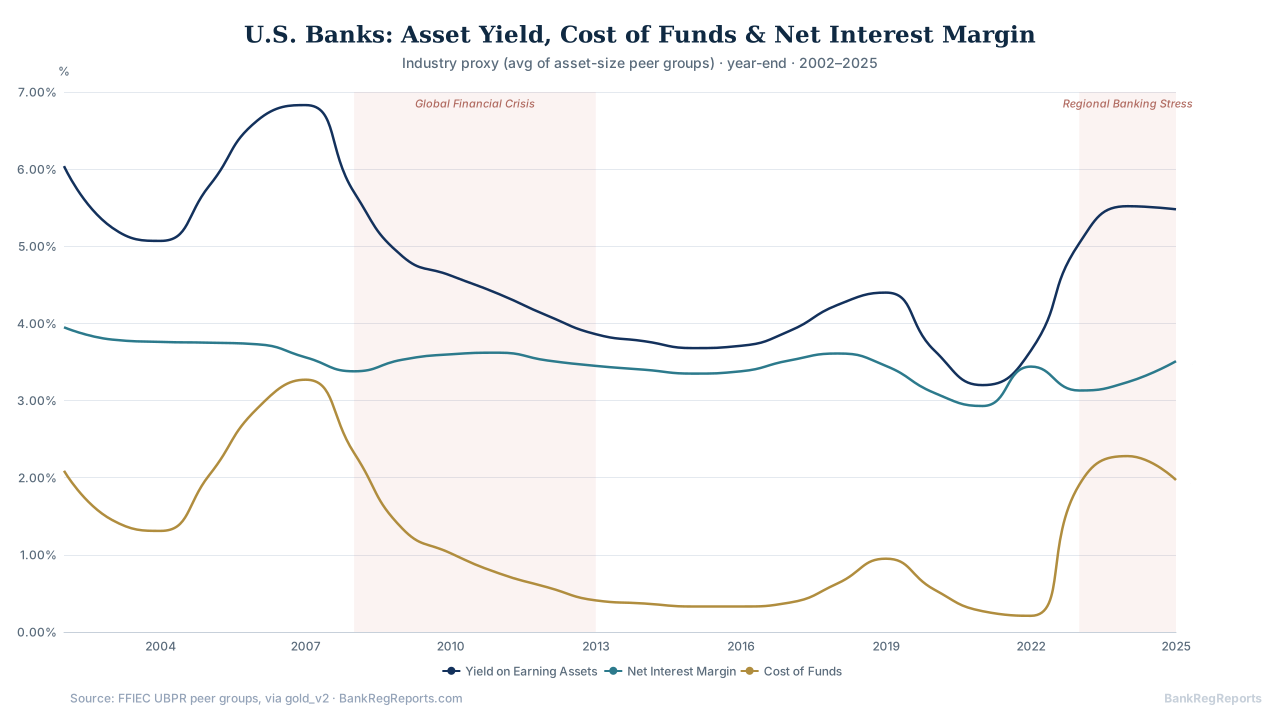
If you have sat in an ALCO meeting since 2022, you know what the rate shock felt like from the inside. Net interest margins expanded, then compressed hard as deposit costs caught up. Unrealized losses on AFS portfolios ballooned.
If you have sat in an ALCO meeting since 2022, you know what the rate shock felt like from the inside. Net interest margins expanded, then compressed hard as deposit costs caught up. Unrealized losses on AFS portfolios ballooned. Deposit beta assumptions that had been comfortable for a decade turned out to be fiction. And suddenly every examiner, every board member, and every analyst wanted to know what your repricing gap looked like across every maturity bucket.
The problem was never that the data did not exist. The problem was that extracting it cleanly from public regulatory filings, and making it comparable across institutions, required either an expensive enterprise data platform contract or weeks of manual parsing. That gap is exactly what BankRegReports was built to close.
Why Is Interest Rate Risk Data Hard to Get Right?
Interest rate risk lives across at least four regulatory reporting forms, each with its own schema, filing cadence, and unit conventions. FFIEC Call Reports (FFIEC 031/041/051) carry the raw balance sheet and income statement items; repricing and maturity breakdowns live in Schedule RC-B Memorandum item 2 (securities), Schedule RC-C Part I Memorandum item 2 (loans), and the Schedule RC-E Memoranda (time deposits). UBPR (Uniform Bank Performance Report) ratios compute duration-sensitive metrics like NIM, cost of funds, and yield on earning assets in a normalized, peer-comparable format. Federal Reserve Y-9C filings capture the same economics at the holding company level for BHCs. NCUA 5300 reports cover credit unions, which face structurally similar repricing risk given their heavy concentration in fixed-rate consumer loans and long-duration mortgage portfolios. For the Call Report and UBPR data, the official source is the FFIEC.
Each of these sources stores rates and ratios differently. The NCUA 5300, for instance, stores rates as integers scaled by 100: what looks like 475 in the raw file is actually 4.75%. FFIEC MDRM codes for net interest margin appear differently across the Call Report versus UBPR crosswalk. If you pull raw files without knowing these conventions, your analysis will be wrong in ways that are hard to catch.
Legacy financial data providers abstract this complexity away but charge accordingly, and they typically give you their interpretation of the data rather than traceability back to the source filing. BankRegReports takes a different approach: every metric carries its source MDRM code, its filing type, and its unit definition, so you always know exactly what you are looking at.
The Metrics That Matter for IRR Analysis
Net Interest Margin and Its Components
NIM is the headline number, but it is the decomposition that matters for IRR modeling. You need:
- Yield on earning assets: sensitive to asset repricing velocity; a bank with a short-duration loan book will see yields move faster when rates rise
- Cost of interest-bearing liabilities: deposit beta is the key variable; not all banks experience the same pass-through rate
- Noninterest bearing deposit share: a structural funding advantage that erodes as rates rise and customers move money into interest-bearing accounts
- Interest rate sensitivity gap: assets repricing within 12 months minus liabilities repricing within 12 months, as a percent of earning assets
Regulators look at these not just in absolute terms but relative to peers. An examiner reviewing a community bank’s IRR position will benchmark NIM and cost-of-funds trends against peer group averages from the UBPR, not against large-bank medians.
The Deposit Beta Problem
The 2022–2023 hiking cycle exposed how wrong most deposit beta assumptions were. Banks that modeled 30–40% betas on interest-bearing checking and money market accounts saw realized betas of 60–80% at larger institutions, while some community banks with sticky, relationship-driven deposit bases held closer to 20–30%.
Quantifying this variation from public data requires pulling cost of interest-bearing deposits (a specific MDRM-coded Call Report line) over time and regressing it against Fed Funds movements. That is a job for programmatic data access, not spreadsheet exports.
Book Value Sensitivity and AOCI
The 2022 rate shock produced something many analysts had not modeled seriously: severe unrealized losses on AFS securities portfolios that, while excluded from regulatory capital under the AOCI opt-out for most community banks, showed up starkly in GAAP equity. Banks with large AFS mortgage-backed security positions saw tangible book value decline 15–25% in a matter of quarters.
These dynamics are visible in public regulatory filings (Schedule RC-B of the Call Report carries AFS and HTM securities with their unrealized gain/loss positions), but parsing them across thousands of institutions requires a reliable data pipeline.
Regulatory Expectations Around IRR Monitoring
Examiners are not just looking at whether you measure interest rate risk; they are looking at whether your measurement is granular enough to be useful. The FFIEC’s Interest Rate Risk Management guidance (SR 10-1 and its successors) expects institutions to have the ability to reprice their balance sheet under multiple rate scenarios, including non-parallel shifts. A static gap report is not sufficient.
What they want to see in the data is the same thing a good ALCO analyst would want to see: the maturity distribution of the loan portfolio, the repricing terms on adjustable-rate instruments, the contractual versus behavioral duration of core deposits, and the sensitivity of noninterest income to rate changes. Most of this flows through public regulatory filings in some form, either directly in the Call Report schedules or derivable from the UBPR ratios and their component MDRM codes.
The FDIC’s data also matters here. FDIC institution-level data carries charter type, asset composition, and supervisory category flags that contextualize risk relative to regulatory expectations for that institution type. A mutual savings bank and a de novo commercial bank face different examiner expectations even at similar asset sizes.
Building a Systematic IRR Monitoring Workflow
The practical workflow for an analyst building systematic IRR surveillance across a peer group looks like this:
- Compute rolling 8-quarter deposit beta implied from cost of interest-bearing deposits against Fed Funds
- Flag outliers versus peer group medians: both high-beta (liability-sensitive risk) and low-beta (possible stickiness advantage worth studying)
- Cross-reference against SEC EDGAR filings for institutions that file 10-K/10-Q, where management discussion sections often contain the IRR disclosures that do not fit in structured regulatory forms
- Layer in Federal Reserve NIC data to understand organizational structure: a bank whose holding company has significant nonbank subsidiaries may have off-balance-sheet rate exposures not visible in the bank-level Call Report
BankRegReports integrates all five of these data sources (FFIEC, FDIC, Federal Reserve, NCUA, and SEC EDGAR) into a single normalized schema so you can run that kind of cross-source analysis without building five separate ETL pipelines.
Getting Started
Interest rate risk is one of those domains where having clean, traceable, programmatic access to regulatory data is the difference between doing real analysis and doing spreadsheet theater.
The free tier covers meaningful historical depth across all major data sources, enough to validate your use case before committing to anything.