CECL vs. ALLL: What Expected Credit Loss Means for Reserves
Walk into any community bank credit committee today and you will find at least one person who still calls it the ALLL. That is not nostalgia; it reflects how deep …
Walk into any community bank credit committee today and you will find at least one person who still calls it the ALLL. That is not nostalgia; it reflects how deep the incurred loss model was baked into credit culture. Loan officers built careers around the idea that you reserved for losses you could see evidence of. The Current Expected Credit Loss standard, CECL, dismantled that logic. The reserve you carry today must reflect losses you expect over the entire remaining life of the loan, not losses you can already document. For a five-year commercial real estate term loan originated in early 2024, that means reserving on day one for credit deterioration that may not show up in 90-day delinquency data until 2027 or later.
The accounting standard (ASC 326) is now effective across all FDIC-insured institutions. SEC filers other than smaller reporting companies adopted in 2020. Smaller reporting companies and non-public community banks completed the transition by January 2023. The shift is over, but the peer comparison and reserve adequacy questions it created are still live in every ALCO package and exam prep conversation.

How the Reserve Ratio Changed, and Why Comparisons Across the Adoption Date Are Unreliable
The most visible impact of CECL was the day-one jump in the allowance balance. Studies of early-adopter large banks showed median ACL (Allowance for Credit Losses, the CECL-era term) increases of 30–50% relative to the prior ALLL balance, with consumer-heavy institutions seeing larger increases driven by long-duration credit card and auto loan portfolios. Community banks with predominantly short-duration commercial loan books saw more modest increases, typically in the 15–30% range, depending on portfolio seasoning and the Q-factor structure they carried into the transition.
The post-CECL benchmark for allowance-to-total-loans at $1B–$10B community banks is approximately 1.1–1.4%. That is meaningfully higher than the pre-2020 ALLL norms of 0.80–1.10% for similar institutions. Examiners understand the methodology break. What they do not forgive is an institution whose ACL ratio has drifted to the bottom of that range without a well-documented rationale tied to actual portfolio credit quality, particularly when peer institutions are running higher coverage.
A ratio below 1.0% at a community bank with any meaningful commercial real estate or construction exposure will draw questions in an exam. A ratio above 1.5% at a bank with a clean, short-duration portfolio may indicate model conservatism that is compressing earnings unnecessarily, but that is a better problem to have than the reverse.
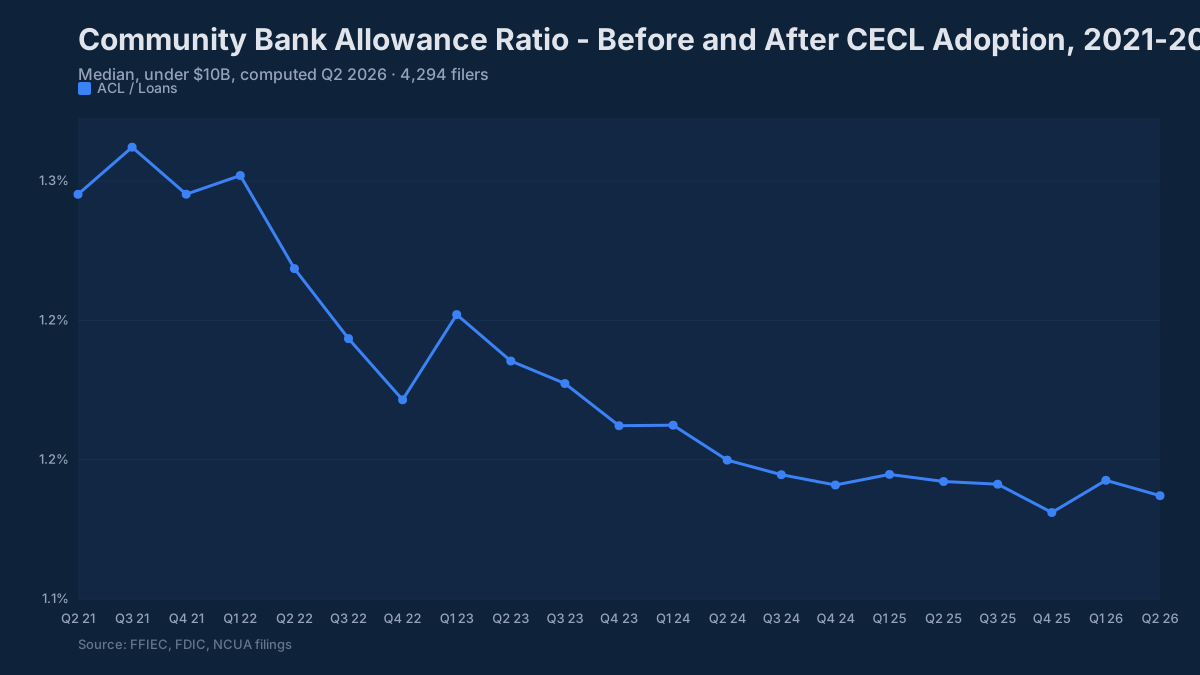
The practical problem for peer benchmarking: any time-series comparison that crosses the adoption boundary without adjustment is misleading. An institution reporting 0.95% ALLL in 2019 and 1.35% ACL in 2024 did not necessarily get riskier. The methodology changed. The BankRegReports platform shows both the legacy ALLL fields and the replacement ACL codes from FFIEC Call Reports so you can build clean bridge comparisons rather than treating the series as continuous.
What Do Examiners Focus On Under CECL?
The CAMELS “A” component (Asset Quality) now includes reserve adequacy as a forward-looking assessment rather than a trailing one. Examiners evaluating your ACL under CECL are asking four questions that did not exist under the old standard:
First, is your reasonable and supportable forecast horizon documented and defensible? Most community banks use 12–18 months as the forecast window before reverting to historical loss rates. That is acceptable, but examiners want to see it written down, consistently applied, and updated each quarter, not a range of “12 to 24 months” that shifts based on what makes the number look better.
Second, are your Q-factors (qualitative adjustments to the historical loss rate) actually tied to identifiable portfolio conditions, or are they a plug to hit a target reserve balance? CECL did not eliminate Q-factors; it put them under a brighter light. An institution that carries the same qualitative overlay for eight consecutive quarters without revisiting whether conditions have changed will get an examiner comment.
Third, does your CRE concentration level justify higher coverage? If your CRE loans meet the interagency guidance screen (300% or more of total risk-based capital with portfolio growth of 50% or more over the prior 36 months), examiners expect to see that concentration reflected somewhere in your ACL methodology, not just in your concentration management policy document.
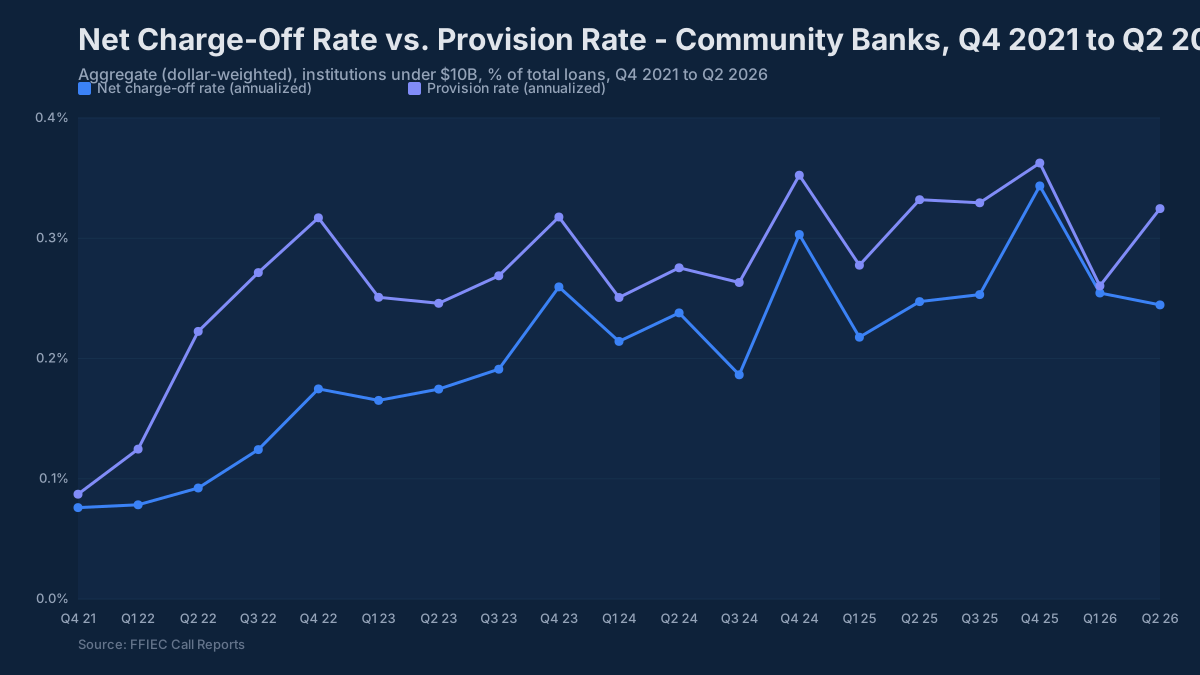
Fourth, how did your reserve behave relative to peers through the 2023–2024 credit normalization cycle? Net charge-offs at community banks ran 0.15% annualized in Q1 2025, matching the pre-pandemic average, per the FDIC Quarterly Banking Profile. The industry-wide rate was materially higher at 0.67%, reflecting credit card losses concentrated at the largest banks, so do not benchmark a community bank against the industry figure. Banks that released reserves aggressively in 2022–2023 and then watched charge-offs tick up in 2024 face harder examiner conversations than banks that held coverage steady.
CECL Model Approaches at Community Banks: What Actually Gets Used
The standard is principles-based, not prescriptive. In practice, the methodology spectrum looks very different at a $500M community bank versus a $5B regional.
The majority of community banks under $2B in assets ended up using some variant of the remaining life or static pool approach, the old ALLL historical loss rate framework extended to a lifetime horizon, with Q-factor overlays to capture forward-looking conditions. This is what most examiners expected, and it is defensible when the portfolio is relatively homogeneous and the historical loss history is at least five to seven years deep.
Banks with larger consumer books (particularly those with credit card, auto, or home equity revolvers) increasingly moved toward vintage analysis, where cohorts of originations are tracked through their loss development curves. This approach requires clean origination-date data, which exposes data quality gaps that the old ALLL system never stressed.
For collateral-dependent financial assets, where repayment is expected substantially through operation or sale of the collateral, ASC 326 offers a practical expedient: measure expected credit losses using the fair value of the collateral, less estimated costs to sell where repayment depends on sale. For these individually evaluated, collateral-dependent loans, the allowance is driven by the collateral value rather than the borrower’s cash flow, so appraisal timeliness drives the number. Examiners who find stale appraisals on the watch list will immediately ask whether the collateral values were updated.
The probability of default and loss given default framework, common at large banks and some mid-size regionals, requires a credit scoring infrastructure that most community banks do not maintain. It is harder to implement but produces more granular lifetime loss estimates by risk grade, useful for banks with well-developed internal ratings but not a practical necessity for most community bank portfolios.
Provision Expense: What the Income Statement Tells You
The reserve balance gets the attention, but the quarterly provision expense is what hits earnings. Post-CECL, provision expense is more volatile because it must respond to changes in loan volume, portfolio mix, credit quality, and the macroeconomic outlook every quarter, not just when charge-offs occur. A bank that originates $50M in new commercial loans in a quarter must immediately book a provision for the lifetime expected losses on those loans, even if every borrower is current and well-collateralized.
This creates a counterintuitive dynamic: a bank growing its loan book in a strong credit environment will show rising provision expense even while credit metrics look clean. Net charge-offs remain at 0.20–0.30% annualized, NPLs are flat, but provision is running above peer because the bank is adding earning assets. Boards that do not understand CECL mechanics sometimes read this as a credit deterioration signal. Your ALCO presentation should explicitly show the volume-driven versus credit-quality-driven components of provision each quarter.
Peer Comparison Without the Data Engineering
Reserve adequacy is inherently a relative analysis. An ACL ratio of 1.15% means nothing without knowing where your peer group sits, how your portfolio composition compares, and how your coverage ratio (ACL divided by nonperforming loans) stacks up against similar institutions. A bank with 1.15% ACL and 0.40% NPLs has dramatically stronger coverage than a bank with 1.15% ACL and 1.80% NPLs, and examiners will read those two situations very differently.
You can pull peer ACL ratios, provision expense trends, NCO rates, NPL coverage ratios, and Q4-to-Q4 reserve changes directly through the BankRegReports platform: filtered by asset tier, geography, charter type, or a custom peer group you define. The data comes from FFIEC Call Reports and FDIC filings with both the legacy ALLL codes and the CECL-era ACL codes preserved, so you are not relying on a vendor’s pre-cleaned series that may have smoothed over the methodology transition. The official source for that Call Report data is the FFIEC. Export to Excel and you have the ACL benchmarking table your credit committee needs.
The reserve adequacy question your next exam will center on is not whether your ACL is above some absolute floor; it is whether your methodology is internally consistent, well-documented, and defensible relative to your actual portfolio risk profile and your peers. That is a harder question, and one that requires current, granular peer data rather than a table from last year’s UBPR.
The benchmarks and peer data referenced in this post are available through the BankRegReports platform. No data engineering required. Search any FDIC-insured bank, pull peer group comparisons, and, on the Pro plan, export to Excel for your ALCO package or board presentation.