FDIC Bank Failure Data: What History Tells Us About Risk
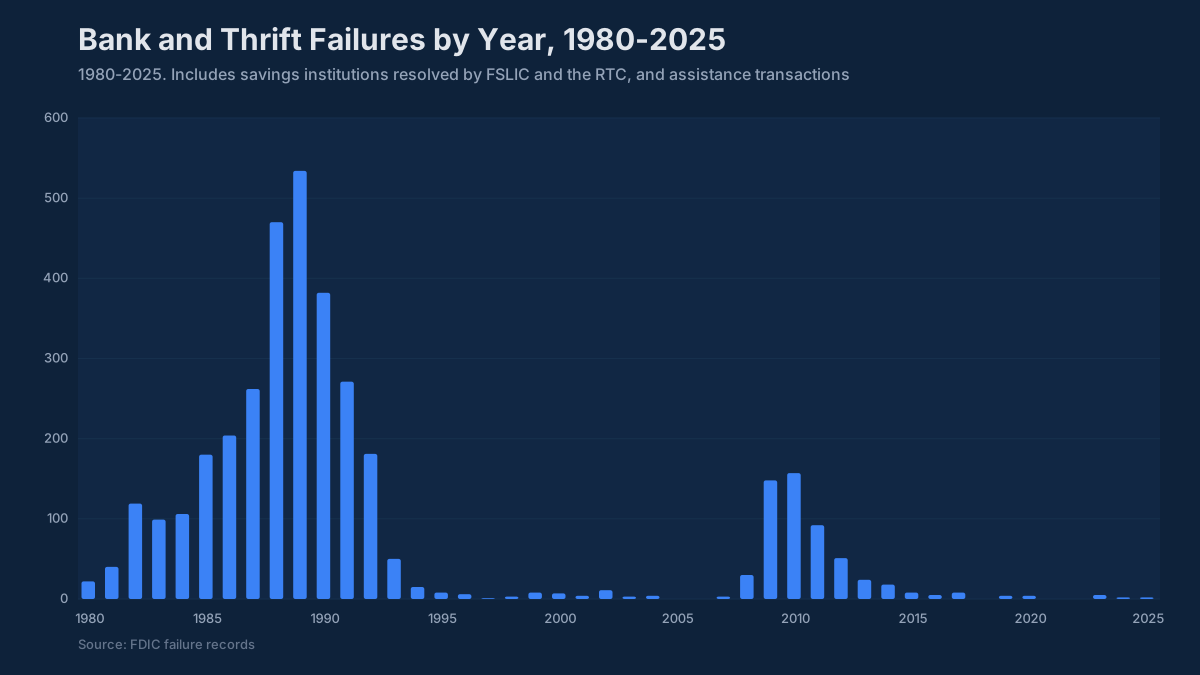
Between 2008 and 2012, the FDIC closed 465 banks. At the peak, 2010 alone, 157 institutions failed, carrying about $92 billion in combined assets into receivership. Every single one of …
Between 2008 and 2012, the FDIC closed 465 banks. At the peak, 2010 alone, 157 institutions failed, carrying about $92 billion in combined assets into receivership. Every single one of those banks had an examiner inside it at some point in the prior 18 months. Many had boards that were receiving management packages showing adequate capital ratios and manageable classified assets. The warning signs were there in the data. The question is whether anyone was looking at the right numbers in the right context.
FDIC bank failure history is the closest thing the industry has to a controlled experiment on bank risk. The dataset spans about 3,500 failures since 1934, plus about 600 assistance transactions, covers every major economic cycle, and records the asset size, charter type, failure date, acquirer, and estimated cost to the Deposit Insurance Fund for each institution. The official source for this failure record is the FDIC. For a CFO, treasurer, or chief credit officer building an ALCO package or preparing for an examination, the patterns in that history are more useful than almost any model output, because they show what actually happened, not what the model predicted.

What Do the Failure Patterns Actually Show?
The first thing that jumps out of the FDIC failure record is how clustered the failures are. This is not a random process distributed evenly across decades. The S&L crisis of the late 1980s and early 1990s produced more than 1,000 failures in roughly seven years. The 2008–2012 cycle produced 465. Outside those two windows, the annual failure count is typically in the single digits.
That clustering tells you something important: bank failures are overwhelmingly cyclical and often correlated within peer groups. When one community bank with heavy construction and land development exposure fails in a given market, the institutions with similar portfolios in that same MSA are almost always under the same pressure. This is why examiners escalate scrutiny across peer groups after an early failure in a region or asset class, because they know the failure distribution is contagious within concentrations.
The 2023 failures (Silicon Valley Bank, Signature Bank, First Republic) looked different in structure but followed the same underlying logic. All three had idiosyncratic concentration risks that were visible in their call report data well before failure: long-duration securities portfolios funded by uninsured, operationally concentrated deposits. The concentration was in liability structure and interest rate risk rather than credit, which made it unfamiliar. The failure mechanism, though, was the same: a specific stress scenario materialized, the institution had insufficient capital or liquidity to absorb it, and confidence collapsed faster than management could respond.
The Pre-Failure Financial Profile
Across the 2008–2012 failures, researchers and examiners who have studied the FDIC data identify a remarkably consistent pre-failure profile. These are not surprises in retrospect.
Nonperforming assets, as a percentage of total assets, typically crossed 3% eighteen to twenty-four months before failure for community bank failures in that cycle. The typical community bank today runs an NPL ratio of about 0.5%. Institutions that failed in 2010 and 2011 were frequently showing NPL ratios of 5–8% twelve months earlier, and in many cases those ratios had been rising for six consecutive quarters before the bank was closed. An NPL ratio above 2.0% draws examiner focus. By the time it reaches 4–5%, the conversation has shifted from monitoring to resolution.
Capital erosion followed the same trajectory. Today the well-capitalized threshold for CET1 is 6.5% and the median community bank sits near 15%. CET1 did not exist in 2010, but failed institutions that year were often still technically well-capitalized under the leverage and risk-based ratios then in force on their last public call report filing, but their capital ratios had been declining for four to six quarters, and the trajectory, not the level, was what the FDIC was watching. A bank at 9% CET1 trending down 150 basis points per quarter is a different risk profile than a bank at 9% with stable ratios.
Efficiency ratios told a parallel story. Community banks that failed typically showed efficiency ratios rising through the 70–80% range as loan losses consumed earnings, before the bank’s capital became impaired. The typical community bank runs 60–65%. Above 70%, the board needs an explanation. Above 80%, the bank is consuming capital to stay open, which is not a sustainable posture.
CAMELS and What the Correlation with Failure Actually Means
CAMELS ratings (Capital, Asset Quality, Management, Earnings, Liquidity, Sensitivity to market risk) are the primary supervisory tool for identifying problem banks. The FDIC does not publish CAMELS ratings publicly, and institutions are prohibited from disclosing them. But the aggregate data is published, and the correlation between CAMELS downgrades and subsequent failure is striking.
Institutions rated CAMELS 4 or 5 are on the FDIC’s Problem Bank List. At the peak of the 2008–2012 crisis, the Problem Bank List held 888 institutions (first quarter of 2011), and problem-bank assets peaked at about $403 billion at the end of 2009. The vast majority of those did not fail; they were recapitalized, merged, or worked through their problem assets with supervisory assistance. But virtually every bank that did fail had been on the Problem Bank List at some point in the preceding 12–24 months.
The CAMELS components that most consistently predicted failure in post-crisis research were Asset Quality (the A) and Capital (the C), specifically the interaction between them. Loan losses that exceeded earnings created capital pressure. Capital pressure reduced the institution’s ability to absorb further losses. That feedback loop, once it accelerated past a certain point, was rarely reversed without external capital injection or merger.
What community bank management teams and boards should understand is that CAMELS ratings are a lagging indicator by design. Examiners assign ratings based on conditions at examination, which occurs on a 12-to-18-month cycle for most community banks. A bank can deteriorate materially between exams. The institutions that performed best in the 2008–2012 cycle, the ones that came through with minimal regulatory action despite operating in the same markets as failed peers, were generally the ones whose internal monitoring was ahead of the examination cycle, not behind it.
The Current Environment vs. 2008–2012
The straightforward question every CFO and risk officer should be asking right now is: how does the current credit environment compare to where things stood in 2007, the last year before the failure wave accelerated?
On most metrics, the system looks significantly stronger. Aggregate CET1 ratios for community banks are roughly double the well-capitalized threshold. Noncurrent loans across the industry are low by historical standards: 0.93% of total loans in aggregate at June 30, 2026 (BankRegReports analysis of Call Report data). Loan loss reserves are stronger following CECL adoption. The credit quality of the commercial real estate portfolios that drove most 2008–2012 failures looks materially different than the construction-and-land-heavy books of that era.
The risk vector that does not look like 2007 is interest rate risk. The 525 basis points of Fed tightening between March 2022 and July 2023 created unrealized losses on fixed-rate securities and longer-duration loans that, at their peak, exceeded the unrealized losses in any prior tightening cycle. For most community banks, those losses were manageable because deposit bases proved stickier than worst-case models suggested. But the institutions with the most severe AOCI impairment relative to capital are worth monitoring carefully, because a second rate shock or a sudden need to realize those losses would change the picture quickly.
Commercial real estate concentration is the other variable that examiners are watching with something close to the same attention they gave construction loans in 2007. The interagency guidance screens (CRE loans at 300% or more of risk-based capital after growth of 50% or more over the prior 36 months, or construction at 100% or more) were issued in 2006 because concentration in that asset class has consistently amplified losses in downturns. Many community banks are operating above 300%. That is not automatically a problem. It is a conversation that needs to happen at the ALCO and board level with clear eyes about market conditions, loan structure, and underwriting quality.
What Your ALCO Package Should Include
The failure history points toward a specific set of metrics that community bank management teams should be tracking on a quarterly basis, not because the FDIC will ask, but because the historical record shows these are the variables that separate institutions that work through stress from ones that do not.
Trend direction matters more than level. A capital ratio of 10.5% trending down for three consecutive quarters tells a different story than 10.5% after a recapitalization. Your ALCO package should show the four-to-six-quarter trend on capital ratios, NPL ratios, classified-to-capital, net charge-off rates, and cost of funds, not just the current quarter snapshot.
Peer comparison is the second essential element. A 1.5% NPL ratio looks very different if your peer median is 0.8% versus 2.2%. Examiner benchmarks are peer-relative. The question an examiner is answering is not “is this ratio acceptable in the abstract” but “is this institution performing materially worse than comparable institutions, and if so, why.” You need to know the answer to that question before the examination, not after.
The BankRegReports platform gives you direct access to peer benchmarks drawn from FDIC call report data, the same underlying source the FDIC uses for its own analysis. You can pull peer group comparisons by asset tier, state, or charter type, and on the Pro plan build a custom peer group and export to Excel in the format your ALCO package already uses. That comparison capability, your institution’s ratios alongside a peer distribution, is what turns a raw ratio into a usable signal.
The early warning indicators that appear consistently in failure research are not exotic. They are public ratios from the Call Report and UBPR: NIM compression, efficiency ratio creep, the Texas ratio (noncurrent loans plus OREO over tangible equity plus the allowance), NPL ratio trend, and ALLL-to-loans coverage. Classified assets are confidential supervisory data, so the Texas ratio is the nearest public proxy for classified-to-capital. Search any FDIC-insured bank at bankregreports.com and you have eight quarters of those ratios alongside peer distributions, ready for your next ALCO presentation or board deck.
The FDIC failure record is ultimately a record of institutions that ran out of time to fix problems that were visible in the data. The banks that survived the same conditions were generally not in better markets or better economic environments. They were watching the right numbers, comparing themselves honestly against peers, and acting before the trajectory became irreversible.
The benchmarks and peer data referenced in this post are available through the BankRegReports platform, no data engineering required. Search any FDIC-insured bank, pull peer group comparisons, and, on the Pro plan, export to Excel for your ALCO package or board presentation.