Yield on Earning Assets: What It Is and How to Calculate It
In Q4 2022, the average yield on earning assets across U.S. community banks sat around 4.3%. By Q4 2023 it had climbed to roughly 5.1%. Net interest margins, however, fell …
In Q4 2022, the average yield on earning assets across U.S. community banks sat around 4.3%. By Q4 2023 it had climbed to roughly 5.1%. Net interest margins, however, fell by about 30 basis points, because deposit costs rose even faster. That divergence is exactly what yield on earning assets is designed to expose.
The metric is one half of the two-part decomposition of net interest margin. It tells you what a bank earns on the assets that actually produce interest income before subtracting what it costs to fund them. On its own it is informative. Paired with cost of funds, it tells you whether a margin problem lives on the asset side, the liability side, or both, which is the question that actually matters in an ALCO meeting.
What Yield on Earning Assets Actually Measures
The formula is straightforward:
Yield on Earning Assets = Total Interest Income ÷ Average Earning Assets
Earning assets are the balance sheet positions that generate interest: loans and leases, investment securities, interest-bearing balances at other institutions, and federal funds sold. Premises, goodwill, foreclosed property, and vault cash do not belong in the denominator. They sit on the balance sheet but produce no interest income.
On the FFIEC 031/041 Call Report, total interest income flows through Schedule RI under RIAD4107. Average earning assets require averaging the opening and closing balance sheet positions from Schedule RC: total loans and leases (RCON2122), investment securities (held-to-maturity RCONJJ34 plus available-for-sale RCON1773), interest-bearing balances (RCON0071), federal funds sold (RCONB987) and securities purchased under agreements to resell (RCONB989). The UBPR handles this arithmetic automatically and presents the ratio in peer-group context, which is why most analysts start there rather than building the calculation from raw RIAD and RCON codes.
One note on prefixes before you pull anything. The same call report item carries a different prefix depending on which form the bank files. FFIEC 041 and 051 filers report RCON, for domestic offices. FFIEC 031 filers report RCFD on a consolidated basis, and RCFN for foreign offices, so total deposits for an 031 filer is RCON2200 plus RCFN2200 rather than RCON2200 alone. Schedule RC-R Part I (regulatory capital and the capital ratios) moved off RCON with the Basel III revisions of 2014 and 2015 and now uses RCOA on the 041 and 051 and RCFA on the 031; Part II (risk-weighted assets) still reports under RCON and RCFD. Query a single prefix and you will silently drop a whole population rather than get an error, and for an RCON-only query that population is the largest banks in the country.
The result is annualized. A bank reporting $48 million in interest income against $920 million in average earning assets is earning 5.22% on its productive balance sheet.
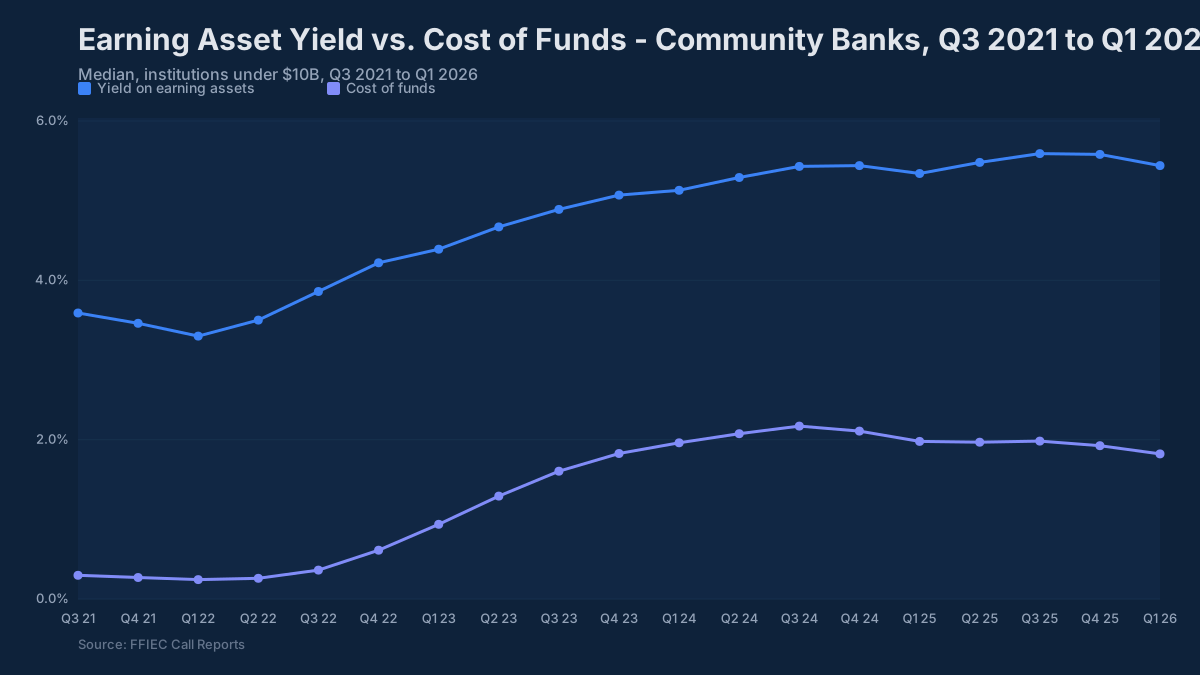
The chart makes the core point visible: yield on earning assets rose sharply after mid-2022, but the margin compressed because funding costs moved faster. That is the standard pattern in a rate-hike cycle for institutions with sticky deposit franchises: asset repricing tends to lag liability repricing. By Q1 2025, community bank NIMs had stabilized in the 3.3–3.5% range, even as asset yields remained elevated.
Two Sides of the Margin
Yield on earning assets pairs with its mirror image:
| Component | What it measures |
|---|---|
| Yield on earning assets | What the bank earns on loans and securities |
| Cost of funding earning assets | What the bank pays to fund those assets |
| Net interest margin (approx.) | The spread, scaled to earning assets |
The denominator choice here matters more than it looks. The UBPR expresses the liability cost as total interest expense divided by average earning assets, not average interest-bearing liabilities. This keeps both ratios on the same base so the spread equals the NIM directly. If you compute yield and cost on different denominators, the arithmetic will not reconcile, and you will spend twenty minutes in an ALCO meeting chasing a calculation error that is actually a methodology mismatch.
When the margin changes quarter over quarter, splitting the change into yield and cost components is the first move. Did yield decline because maturing loans are reinvesting at lower spreads? Did costs jump because CD maturities repriced en masse? The decomposition answers that in one step and points directly toward the remedy, or the absence of one.
Three patterns cover most quarters:
- Margin up because yield rose faster than funding costs. The bank is benefiting from rising rates or a richer asset mix.
- Margin down because yield fell while funding costs held. Asset repricing or loan competition is the problem.
- Margin down because funding costs rose faster than yield. A deposit beta or funding mix problem, not an asset problem.
Tracking the yield against peers adds the second dimension: a yield well above peers can signal aggressive, higher-risk lending, and a yield well below peers usually means a conservative, securities-heavy asset mix.
A Worked Example
| Item | Amount |
|---|---|
| Total interest income (RIAD4107) | $48 million |
| Average earning assets | $920 million |
| Yield on earning assets | 5.22% |
| Total interest expense | $14 million |
| Average earning assets | $920 million |
| Cost of funding earning assets | 1.52% |
| Net interest margin (approx.) | 3.70% |
The bank earns 5.22% and pays 1.52%, producing a margin of 3.70%, above the Q1 2025 community bank average of roughly 3.3–3.5%. If next quarter the yield drops to 5.05% while funding costs hold at 1.52%, the margin falls to 3.53%. That is an asset-side problem: loan repricing, a mix shift toward lower-yielding assets, or competitive pricing pressure. The corrective action is different than if funding costs had risen to 1.69% with yield unchanged. The decomposition tells you which fire you are fighting.
What Moves the Yield
Asset mix is the primary driver. Loans yield more than securities. Within the loan book, consumer installment, certain commercial segments, and credit cards yield more than residential mortgages or owner-occupied CRE. A bank that deliberately repositions toward higher-yield commercial lending will see asset yield rise, along with credit risk. Schedule RC-C on the Call Report breaks the loan portfolio into enough subcategories to see exactly where a yield shift originates.
Repricing speed and rate environment. A book of variable-rate commercial loans tied to SOFR or prime reprices within weeks of a Fed move. A portfolio of fixed-rate 30-year mortgages reprices over decades. Banks with short asset duration saw yields climb quickly through 2022–2023; institutions that had loaded up on long-duration agency securities watched peers benefit while their own yields lagged, sometimes by 100 basis points or more. That gap compressed NIM and became the defining ALCO story of that rate cycle.
Competitive pressure. In markets with heavy bank and credit union competition, loan pricing tightens. Community banks in dense metro markets sometimes accept thinner spreads to maintain origination volume, which shows up as a yield below what the rate environment and risk profile would otherwise suggest. The UBPR peer comparison makes this visible when a bank’s yield trails its cohort by a meaningful margin without a corresponding advantage in credit quality.
Loan fees. Upfront origination fees are amortized into yield over the loan term under the effective-interest method. Banks that originated a surge of PPP loans in 2020 recognized inflated yields through 2021–2022 as those fees accrued into income. That effect was real in the data and caused genuine confusion when comparing yields across time without accounting for it. Any year-over-year yield comparison that spans 2020–2022 should carry that caveat.
Reading the Yield Against Peers
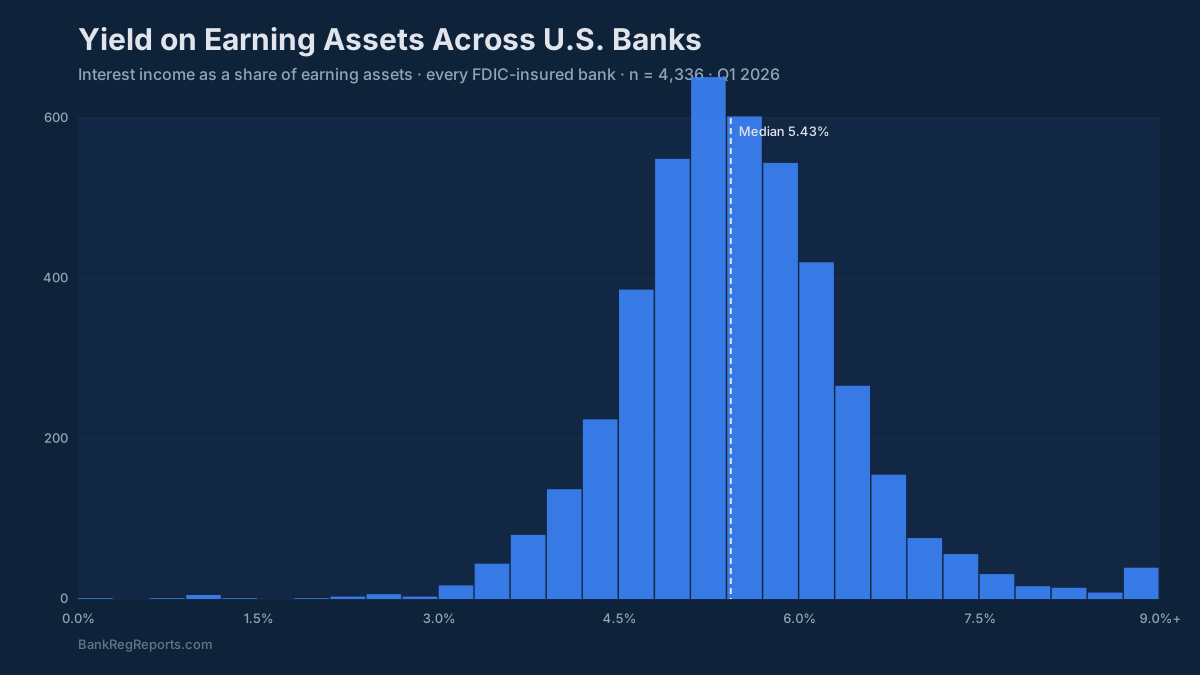
A yield number in isolation tells you almost nothing. A 5.5% yield at a bank concentrated in commercial real estate is unremarkable in the current environment. The same yield at a bank with 60% of its book in agency MBS suggests risk-taking somewhere else in the portfolio, or fee acceleration from a non-recurring source.
Community bank peers were typically earning in the 4.75–5.75% range on earning assets as of Q4 2024, with the distribution skewing higher for institutions with more CRE and C&I concentration and lower for those with large securities portfolios accumulated in the 2020–2021 low-rate window. Banks above 7% are almost always high-consumer or specialty lenders, and the yield premium there should be evaluated alongside NCO rates, which as of Q1 2025 ran about 0.6% industry-wide and nearer 0.15% at community banks, and meaningfully higher in consumer-heavy books.
BankRegReports tracks yield on earning assets quarterly for every U.S. FDIC-insured bank with more than 25 years of history and benchmarks each institution against configurable peer groups. When a bank runs 80 basis points above its peer average on asset yield, the analytical question is whether that reflects better loan pricing, a riskier mix, or fee income accelerating ahead of schedule. All three look identical in the ratio until you cross-reference Schedule RI-B loss metrics and the loan composition breakdown.
Asset quality is the natural companion metric. A yield persistently above peer, combined with rising provision expense and deteriorating NPL ratios (the median $1B–$10B bank’s noncurrent loan ratio was 0.43% at March 31, 2025, against about 1.0% for the industry in aggregate, with anything above 2.0% drawing examiner attention) is a materially different situation than the same yield alongside clean credit. The margin looks strong right up until the provision catches up.
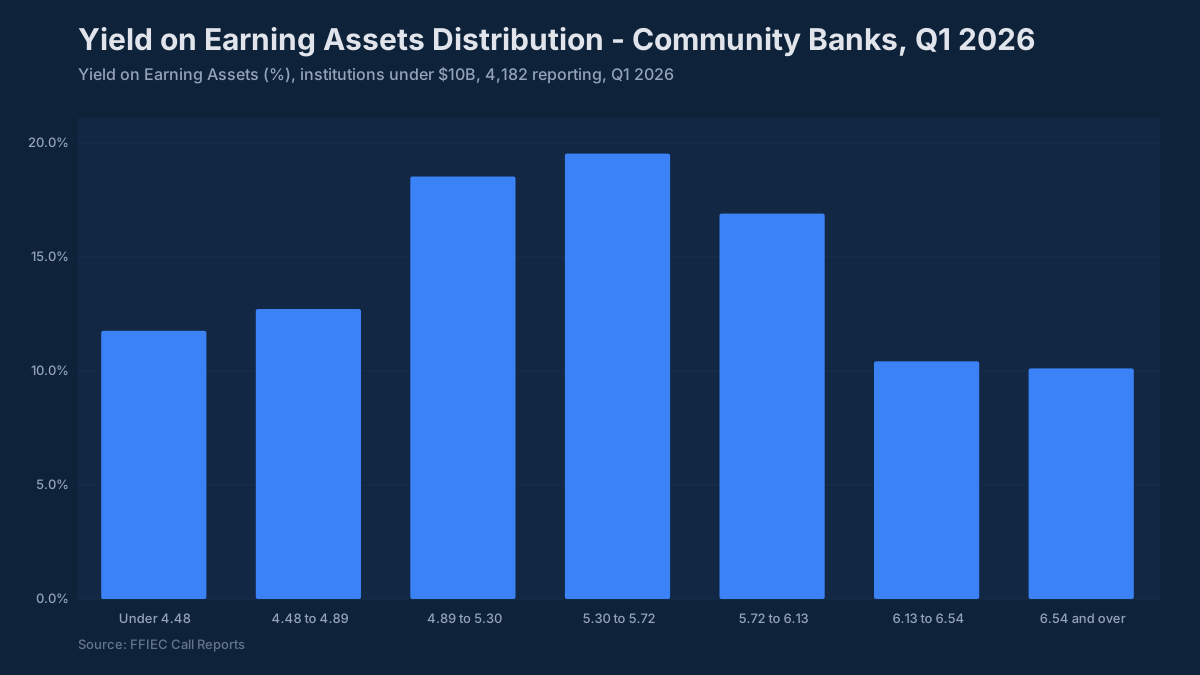
The distribution matters because it shows what “high” and “low” actually mean at a specific point in the rate cycle. A yield in the top quartile warrants examination: it is either disciplined asset pricing or elevated risk, and the rest of the Call Report usually settles which.
What Examiners and Boards Focus On
Examiners reviewing interest rate risk under the CAMELS framework look at yield on earning assets primarily in the context of repricing mismatches and NIM trajectory. A bank whose yield has been flat for four quarters while peers have repriced upward will generate questions about fixed-rate concentration, hedging strategy, or both. The conversation typically moves to duration, the securities portfolio composition, and whether loan pricing discipline has been maintained as origination volume slowed.
Board members need a simpler version of the same story: is the bank earning more or less on its assets than comparable institutions, and is that gap widening or narrowing? A CFO presenting to the board should show yield on earning assets alongside NIM and cost of funds as a trio, not as standalone numbers, and frame the trend against the peer quartile rather than just a prior quarter’s change. The quartile context is what makes the number useful rather than decorative.
Yield on earning assets that drifts below peer by more than 50 basis points over multiple quarters without a corresponding cost advantage is a strategic question, not just an analytics question. It means the bank is either underpricing risk, holding too much low-yield liquidity, or carrying a securities portfolio that was built for a different rate environment. Each of those has a different remediation path, and the analysis starts with this ratio.
How to Find a Bank’s Yield on Earning Assets
Both inputs come from the Call Report: total interest income from the income statement (Schedule RI) and the earning asset balances from the balance sheet (Schedule RC). The UBPR does the averaging and presents the yield next to the cost of funds and the net interest margin, each with a peer group average and a percentile, so the UBPR page is the fastest place to read all three at once.
BankRegReports charts yield on earning assets, cost of funds, and net interest margin together for every FDIC-insured bank across more than 25 years of quarterly history, and benchmarks each one against the bank’s peer group. Seeing the three side by side across several rate cycles is what turns a single margin number into an explanation of why a bank earns what it earns. Look up any bank from the bank directory and open its profitability metrics.
Frequently Asked Questions
What is yield on earning assets? The average interest rate a bank earns on its income-producing assets. Total interest income (RIAD4107) divided by average earning assets (loans, securities, interest-bearing balances, and fed funds sold), expressed as an annualized percentage. It is the gross return on the productive balance sheet before deducting funding costs.
How is it calculated from Call Report data? Take total interest income from Schedule RI (RIAD4107), divide by average earning assets derived from Schedule RC. Average earning assets are typically computed as the mean of beginning- and end-of-period balances across the major earning asset categories. The UBPR handles this automatically and presents it in ratio form with peer group data based on asset size.
How does yield on earning assets differ from net interest margin? Yield on earning assets is the gross return. Net interest margin subtracts the cost of funding those assets. The NIM is the spread; the yield is one leg of it. You cannot diagnose a margin problem without knowing whether the issue is on the asset side, the liability side, or both, which is exactly why the decomposition exists.
What drives one bank’s yield above another’s? Primarily asset mix: loans yield more than securities, and riskier loan categories yield more than lower-risk ones. After that: how quickly the book reprices in a given rate environment, competitive pricing discipline in the bank’s lending markets, and whether upfront fee income is being recognized faster or slower than peers.
Is a higher yield always a positive sign? No. A yield above peers can reflect disciplined loan pricing, but it frequently reflects a riskier asset mix, aggressive growth into thinner-underwritten segments, or fee acceleration from a temporary source. Read it alongside Schedule RI-B credit metrics, NPL ratios, and the NCO rate before drawing conclusions about quality versus risk.
Where can I find a bank’s yield on earning assets? It is derived from interest income and earning assets on the Call Report and standardized on the UBPR, which shows it with a peer group average and a percentile. BankRegReports displays it alongside cost of funds and net interest margin for every U.S. bank, with quarterly history and peer comparisons.
Where does BankRegReports get this data? From FFIEC Call Report bulk files (FFIEC 031/041/051), processed using the same methodology the UBPR applies. BankRegReports normalizes the data across more than 25 years of quarterly history and makes it available through the API with peer-group benchmarking, enforcement history, and UBPR trend data for every FDIC-insured institution.
The data in this post is available through the BankRegReports platform. Pull peer benchmarks, Call Report metrics, UBPR trends, and enforcement history for any FDIC-insured bank, no data engineering required.