Yield Curve and Bank Profitability: A Data-Driven Analysis
If you have sat in an ALCO meeting during a rate cycle, you already know the yield curve is not an abstraction. It is the primary driver of how your …
If you have sat in an ALCO meeting during a rate cycle, you already know the yield curve is not an abstraction. It is the primary driver of how your institution’s income statement is going to look in six to twelve months. The slope between the two-year and ten-year Treasury, the speed of the Fed’s moves versus deposit repricing, these are the variables your CFO is tracking on a whiteboard before they ever show up in your quarterly NIM.
What is harder is quantifying the link between the yield curve and bank profitability systematically, across a population of institutions, in a way that holds up under regulatory scrutiny. That requires clean, standardized data, the kind that historically meant either paying a legacy financial data provider five figures per seat or spending six months building your own ingest pipeline from FFIEC bulk downloads.
This post walks through the mechanics of the yield curve’s effect on bank profitability, and how BankRegReports makes it practical to run that analysis yourself using real regulatory filings.
Why Does the Yield Curve Matter More for Banks Than for Most Industries?
Banks borrow short and lend long. That is the core of the business model, and it means the shape of the yield curve is not just a macroeconomic indicator; it is a direct input to bank earnings.
When the curve is steep (long rates well above short rates), a bank can fund itself cheaply in overnight or short-duration deposits and earn a wider spread on fixed-rate mortgages, commercial real estate loans, and investment securities. Net interest margin expands. When the curve flattens or inverts, that spread compresses: funding costs chase short rates upward while asset yields on existing fixed-rate books reprice slowly or not at all.
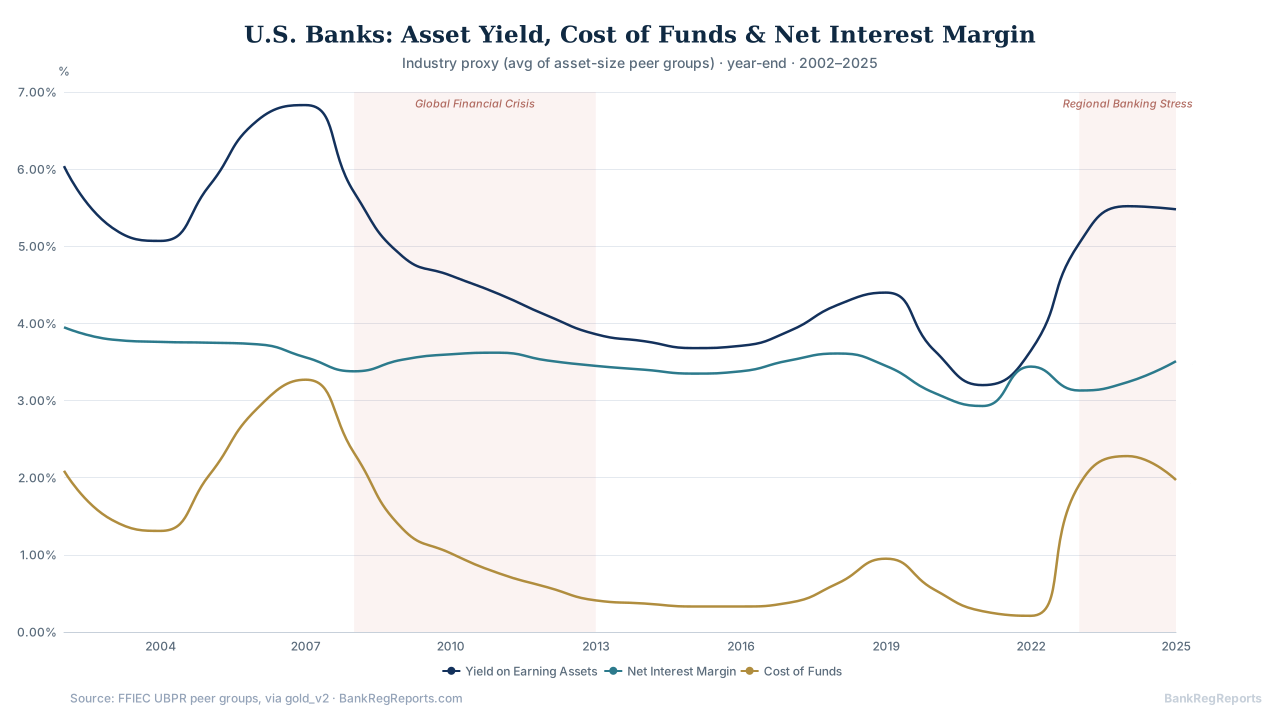
The 2022–2023 tightening cycle was a particularly sharp demonstration. The Fed moved 525 basis points in about 16 months. Short-end funding costs repriced almost immediately, particularly at institutions with higher uninsured deposit concentrations. But many banks were carrying fixed-rate assets originated at 2020–2021 lows. That produced a period of acute NIM compression and, in a handful of cases, the kind of unrealized loss accumulation in available-for-sale securities that becomes a going-concern issue when depositors start asking questions.
The Mechanics: Asset Sensitivity vs. Liability Sensitivity
ALCO practitioners frame the yield curve exposure through balance sheet sensitivity. An asset-sensitive institution holds more assets that reprice in the near term than liabilities. In a rising-rate environment, asset-sensitive banks should theoretically see NIM expansion. A liability-sensitive book does the opposite.
The practical complexity is that deposit behavior rarely matches contractual terms. Non-maturity deposits (checking, savings, money market) have no stated maturity, but their effective duration and their beta (the pass-through of Fed rate changes into deposit costs) are empirical questions answered by historical data. Getting those betas right from regulatory filings requires parsing FFIEC Call Report schedules at a level of granularity that most analysis skips. The official source is the FFIEC.
Measuring the Relationship Empirically
Using UBPR ratios sourced through BankRegReports, we can pull NIM over time for a cohort of community banks and overlay the two-year/ten-year Treasury spread.
What you get back is quarterly, institution-level UBPR data normalized to a consistent schema: no parsing XBRL, no wrestling with FFIEC CDR bulk zip files, no gap-filling across filing amendments. The underlying data traces back to raw Call Report schedules (RC, RI, RC-K, RC-N) ingested from FFIEC filings, processed through standardized MDRM-keyed definitions.
What the Data Shows Across Rate Cycles
The 2s10s spread inverted for good in July 2022. The median net interest margin for banks with $1 billion to $10 billion in assets kept rising for two more quarters, to 3.57% at December 31, 2022, then fell to 3.07% by March 31, 2024 (BankRegReports analysis of Call Report data). That lag reflects the combination of fixed-rate asset runoff, deposit repricing stickiness, and the mechanical delay between when the Fed moves and when institutions actually reprice their cost of funds.
The inversion showed up in NIM data from the first quarter of 2023, even though rates themselves were still elevated. The issue was not the level of rates; it was the shape. Once the curve inverted, banks that had extended duration to chase yield in 2020–2021 found themselves funding at Fed Funds plus deposit competition while holding assets priced at 2021 levels.
Institutions with stronger core deposit franchises (lower uninsured deposit ratios, higher proportions of non-interest-bearing demand deposits) showed meaningfully better NIM resilience. That variable is quantifiable at the institution level from FFIEC Call Report Schedule RC-E data.
Beyond NIM: The Full Profitability Picture
NIM is the headline, but yield curve profitability analysis should look at the full income statement impact.
Provision expense tends to rise when the curve inverts because curve inversion often precedes credit deterioration. Loan growth also slows. Banks that had been originating into a steepening curve suddenly face tighter spreads on new production and rising credit costs on the existing book.
Non-interest income partially offsets NIM compression at institutions with fee-heavy business models: mortgage banking, wealth management, card income. But mortgage banking income is itself curve-sensitive: a flat or inverted curve kills refinance volumes.
Efficiency ratios tend to lag because operating expense is largely fixed in the near term. A bank that saw NIM expand 40 basis points during 2022 and hired to the higher revenue base is carrying that expense into a compression environment.
All of these dimensions are available from FFIEC Call Reports and UBPR through BankRegReports, normalized across institutions and quarters without the institutional knowledge overhead that enterprise data platforms require.
Pulling Cross-Sectional Data for Peer Analysis
One of the most useful applications is peer benchmarking: understanding where a specific institution sits relative to its asset-tier peer group across a rate cycle.
Built from scratch, that cross-sectional pull means a full FFIEC bulk download, parsing, deduplication and normalization. Through the BankRegReports Data API it is one request per metric, and the peer group method is the same one the UBPR uses.
Data sources accessible through the platform span FFIEC Call Reports and UBPR ratios, FDIC institution data and historical financials, Federal Reserve NIC entity and holding company data, Y-9C filings for bank holding companies, NCUA 5300 Call Reports for credit unions, and SEC EDGAR filings for public bank holding companies. That breadth matters for yield curve analysis because the transmission mechanism works differently across institution types and charter classes.
Practical Takeaways for Practitioners
A few things hold up across cycles when you look at the regulatory data systematically:
-
Deposit franchise quality is the most durable NIM buffer. Institutions with high non-interest-bearing demand deposit ratios consistently outperform on NIM during compression cycles. This is visible in Call Report RC-E data and is the single variable most worth tracking peer-relative.
-
Securities portfolio duration is the hidden risk. HTM reclassifications from 2020–2022 masked unrealized losses from regulatory capital ratios but not from economic reality. That mismatch shows up in FFIEC data when you look at the gap between book and market.
-
Lag effects are real. In the last cycle, NIM compression showed up about two quarters after the curve inverted. Institutions and analysts who watch only the current quarter miss the trajectory.
-
Loan repricing schedules matter more than most models assume. The pace at which the loan book reprices is a function of product mix, origination vintage, and contractual terms, all partially visible from Call Report schedule data at a level of granularity that most institutions do not expose externally.
Where to Take This Next
The test worth running on your own bank is simple: chart your quarterly NIM against the 2s10s spread for 2019 through today and measure the lag. If your lag is shorter than your peer group’s, your funding base reprices faster than theirs, and your interest rate risk model should say so. For the duration side of that question, see interest rate risk and duration in banks.
The hardest part of this analysis has historically been the data work: parsing FFIEC bulk files, reconciling MDRM codes across form revisions, handling amendments. BankRegReports does that part, so the time goes into the analysis.