Bank Failure Prediction: Early Warning Signs in the Data
Silicon Valley Bank's held-to-maturity unrealized losses (roughly $15 billion against a $16 billion equity base) appeared in each of its 2022 Call Reports. The data was public, filed on schedule, …
Silicon Valley Bank’s held-to-maturity unrealized losses (roughly $15 billion against a $16 billion equity base) appeared in each of its 2022 Call Reports. The data was public, filed on schedule, available to anyone with a login to the FFIEC’s Central Data Repository. The problem was not data access. The problem was that almost no one had it assembled in a form that made the trajectory visible until the institution was already in trouble.
That gap between “the data exists” and “the signal is usable” is the central challenge in bank risk monitoring, and it applies equally to community banks at $500 million in assets as it does to SVB at $200 billion. The early-warning indicators that precede failure are well-documented after four decades of CAMELS examinations and FDIC post-mortems. What changes is the speed at which you can see them move.

Which CAMELS Signals Actually Precede Failure?
The academic literature and the FDIC’s own failure analyses converge on a consistent set of leading indicators. What is useful for a working community banker or risk officer is knowing which metrics to watch, what thresholds matter, and how much time you typically have between a deteriorating signal and supervisory action.
Capital trajectory is more predictive than capital level. A bank sitting at 10% CET1 that has shed 300 basis points across four consecutive quarters is a materially different risk profile than one at 7.5% that has been stable for two years. The regulatory minimums are well-known (6.5% CET1 for well-capitalized status, 4% Tier 1 leverage minimum, 5% for well-capitalized), but those thresholds do not fire until the institution is already in distress. For peer group monitoring, community banks in the $1B–$10B range carry median CET1 around 13%. A bank that drops below 10% and keeps moving deserves attention before the 6.5% floor becomes relevant.
Asset quality metrics tell a similar story, but with a timing problem: NPL ratios lag. By the time nonperforming loans to total loans crosses 2.0% (which is the level where examiner scrutiny reliably intensifies, against a community bank median closer to 0.4–0.5%), the credit losses driving it are often six to eight quarters old. The earlier signal is classified loan migration: credits moving from pass to special mention, or from special mention to substandard, before they become nonperforming. Risk ratings are internal and examination data, not Call Report data, so outside analysts cannot see that migration directly. The nearest public proxy is the 30-89 day past-due bucket in Schedule RC-N, which often turns before loans reach nonaccrual.
Net charge-off rates near 0.15% are typical for community banks in a normal credit environment, matching the pre-pandemic average. Sustained movement above 0.75% is worth explaining at the credit committee level. Above 1.0% annualized, it starts showing up in examiner workpapers.
In failure studies, the divergence between failed institutions and their peers often appears several quarters before failure, well inside the window where you can still act, and well before any market signal would be visible for a community bank that is not publicly traded.
CRE Concentration: Where Community Banks Actually Live
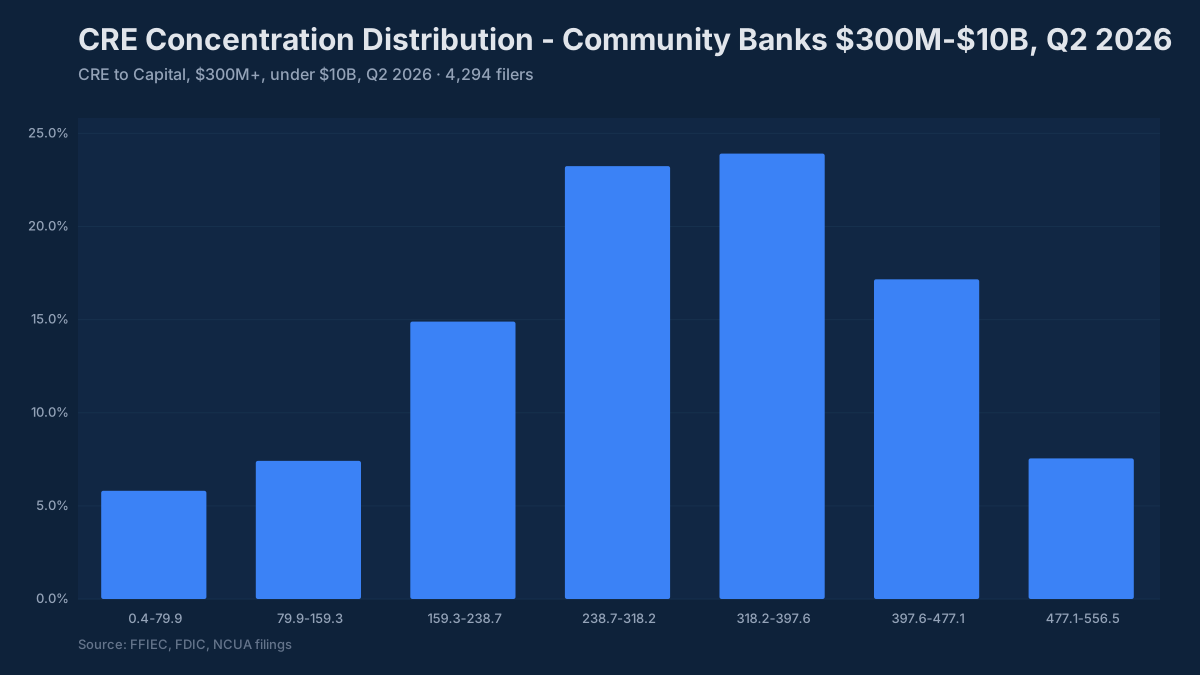
The 2006 interagency guidance on CRE concentration (total CRE at 300% of total risk-based capital combined with 50% growth over 36 months, or construction and land development at 100%, as screens for heightened supervisory attention) remains the most consistently cited concentration benchmark in community bank exam findings, though it is a screen rather than a limit. What the guidance threshold does not tell you is where the industry actually sits.
A meaningful share of $300M–$3B community banks carry CRE concentrations above 300% of RBC. That is not inherently disqualifying, and examiners know it. What matters is the combination: concentration level plus underwriting standards plus stress-test outcomes plus management oversight. A bank at 350% CRE concentration with current loan review, seasoned loss history, and documented stress scenarios is in a different conversation than one at 350% with stale appraisals and a loan review backlog.
What did precede failure in the 2008–2012 cycle was construction and land development concentration above the 100% threshold combined with rapid loan growth, books that had doubled or tripled in three years. That combination appeared in the regulatory filings of virtually every institution that failed during that period, usually four to six quarters before the actual failure event.
Earnings and Liquidity: The Signals That Travel Together
Pre-provision net revenue as a percentage of average assets is the cleanest measure of core earnings power because it strips out the timing noise of loan loss provisioning. A community bank generating 1.5–2.0% PPNR/AA has meaningful capacity to absorb credit losses before capital is impaired. Below 1.0%, the math gets tight quickly when a credit cycle turns.
The efficiency ratio benchmark for community banks (60–65% is the typical range, below 60% is genuinely strong, above 70% starts generating board questions) matters here because operating cost structures are largely fixed over short time horizons. When revenue compresses (NIM was under pressure through 2023–2024 as deposit repricing caught up to earning asset yields), institutions with efficiency ratios already at 68–70% had very little room before earnings turned negative.
Community bank NIM sat around 3.3–3.5% as of Q1 2025, after deposit beta caught up. Cumulative deposit betas ran 35–55% across the 2022–2024 hiking cycle for community banks, lagged by roughly two quarters relative to the Fed funds rate. That lag is over now. What mattered for 2025 ALCO conversations was how the institution was positioned for rate cuts: banks that locked in longer-duration fixed-rate loans during the low-rate period are still holding them.
On liquidity, three metrics travel together in failure histories: brokered deposit concentrations above 15–20% of total deposits, loan-to-deposit ratios above 90% (the community bank median is 70–80%), and FHLB advance reliance that constitutes a material share of total funding. None of these is automatically problematic. All three together, combined with deteriorating asset quality, is how the liquidity piece of a failure unfolds.
What Examiners Are Looking For vs. What the Board Sees
Boards typically see capital ratios, NPL ratios, ROA, and efficiency, the headline CAMELS indicators, presented quarterly. That is appropriate for board-level oversight. Examiners go three layers deeper.
The CAMELS “S” component (sensitivity to market risk) gets more weight than most boards realize. Interest rate risk exposure is assessed through earnings-at-risk and economic value of equity simulations, and examiners will compare a bank’s IRR position to peer behavior. A community bank that looks fine on all the standard ratios but has a liability-sensitive balance sheet with compressed NIM heading into a rate-cut environment can receive an MRA on sensitivity even when credit quality is clean.
The “M” component (management) is assessed partly through loan review quality, policy exception tracking, and whether classified asset ratios are moving faster than the NPL ratio (which suggests recognition lag). These signals show up in the regulatory data: banks with NPL ratios that are flat or improving while charge-offs are accelerating are often recognizing losses before they flow through the NPL line, which is the opposite of the problem. The concern is when NPLs are flat and charge-offs are flat, but classified assets are climbing.
How to Track These Signals Without Building a Data Pipeline
The indicators described here (capital trajectory, CRE concentration, past-due migration, PPNR, liquidity ratios, brokered deposit reliance) are all derived from public FFIEC Call Report and UBPR data, whose official source is the FFIEC. The challenge has historically been assembling a clean, longitudinal panel across 4,500+ institutions without a team of data engineers.
The BankRegReports platform makes that assembly available directly through the web interface. You log in, search for your institution or define a peer group by asset size and geography, and the platform returns the quarterly trend data and peer distributions already calculated. On the Pro plan, export to Excel and you have the inputs for your ALCO package or credit committee presentation without any back-end work.
For institutions that want to run peer screening (identifying which banks in a market or peer group are showing early deterioration in capital trajectory or asset quality), the same data is available through the platform’s peer comparison tools.
The Forward View
Bank failure rates remain historically low. The 2023 stress event was concentrated in a specific sector: uninsured deposit-heavy institutions with large HTM portfolios and rapid growth funded by venture capital deposits. Community banks at $300M–$3B in assets do not share that profile.
What warranted attention heading into 2025–2026 was the credit normalization underway in office CRE and certain consumer segments, combined with the NIM compression that had pushed ROA below 1.0% at a meaningful share of community banks. An institution managing through compressed earnings with rising credit costs and a CRE book above 300% of RBC is exactly the combination that produces exam findings, not failure, necessarily, but the kind of scrutiny that creates operational drag.
The early warning is in the data. The question is whether your institution is monitoring it at peer-group scale or waiting for the examination to tell you.
The benchmarks and peer data referenced in this post are available through the BankRegReports platform, no data engineering required. Search any FDIC-insured bank, pull peer group comparisons, and, on the Pro plan, export to Excel for your ALCO package or board presentation.