Community Bank Trend Analysis: What the Charts Show
When the Fed raised rates 525 basis points in about 16 months (March 2022 to July 2023), cumulative deposit beta for the median bank with $1 billion to $10 billion …
When the Fed raised rates 525 basis points in about 16 months (March 2022 to July 2023), cumulative deposit beta for the median bank with $1 billion to $10 billion in assets came to about 42 percent: its cost of total deposits rose from 0.18% at March 31, 2022 to a peak of 2.37% at September 30, 2024, or about 42 cents for every dollar of rate increase (about 53 percent on interest-bearing deposits alone). Many ALCO models had assumed faster pass-through. That lag explains why NIM held better than expected through 2022 and into early 2023 before the compression arrived in force. It also explains why so many community bank boards sat through 2024 ALCO meetings asking a reasonable question: the model said our NIM would recover when rates fell, so why is it still under 3.4%? The answer lives in the charts, specifically in what the trend lines show about asset repricing lags, funding mix shifts, and where the peer group actually landed after the cycle.
Reading those charts well is the difference between a board conversation that builds confidence and one that generates more questions than it answers. Here is what the key trend charts actually mean, what the benchmarks look like for community bank trend analysis in 2025, and what examiners and directors are looking for when they see the data. The trend data itself comes from the quarterly Call Report, whose official source is the FFIEC.
Net Interest Margin: The Most-Watched Line in the ALCO Package
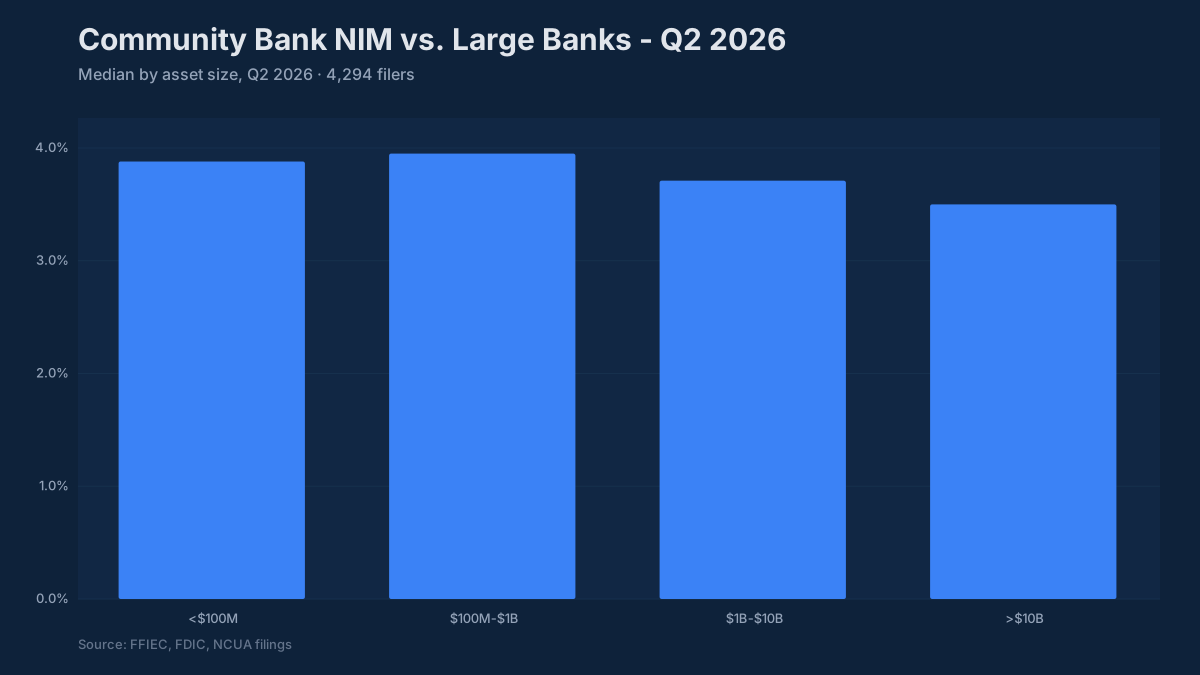
The median net interest margin for banks in the $1B–$10B range entered 2025 at 3.31% (December 31, 2024), up from a cycle low of 3.07% in March 2024 and below the 3.57% peak at the end of 2022. Many institutions had reported higher margins earlier in the rate cycle. The compression from those highs is not dramatic by historical standards, but it arrived on top of a period when many banks had already compressed their loan pricing to compete for volume during 2020–2021, making the starting point lower than it might have appeared.
The trend chart on NIM tells three distinct stories depending on the institution’s asset mix. Banks with floating-rate loan books (heavy C&I, construction, or lines of credit) saw their asset yields rise quickly with the Fed, and their NIM charts show a clean expansion arc from 2022 through mid-2023. Banks with fixed-rate residential mortgage concentrations or securities portfolios built at 2020–2021 yields show a much flatter or even declining NIM through that same window, because the asset side could not reprice to match deposit cost increases. Then there is a third group: institutions with CD-heavy funding structures whose cost of funds continued rising through 2024 even as the Fed paused, because maturities kept rolling at higher rates. Their NIM charts show compression continuing well past the point where the rate environment stabilized.
For board presentation purposes, a NIM above 3.5% with a flat or widening trend is a straightforward positive message. A NIM between 3.0% and 3.5% is the median band, acceptable but worth explaining the trajectory. Below 3.0% for a community bank without a specific strategic rationale (a deliberate fee-income model, a balance sheet dominated by well-structured securities, a deposit-heavy strategy with planned low-cost funding) requires a clear explanation to both the board and the examiner.
Examiners evaluating the earnings component of CAMELS look at NIM alongside the interest rate risk model outputs. The specific question is whether the institution’s asset-liability structure is consistent with its NIM trend and whether the IRR model has captured the actual behavioral repricing of deposits, not just the contractual repricing. The banks that got into trouble in 2023 and 2024 were often the ones whose models had assumed faster deposit repricing on the way up and faster cost normalization on the way down than actually occurred.

Efficiency Ratio: The Metric That Surprises Management Teams Most
The efficiency ratio (non-interest expense divided by net revenue) is the one metric where community bank management teams most frequently discover a gap between how they feel they are operating and where the peer data puts them. The typical community bank in the $300M–$3B range runs an efficiency ratio between 60% and 65%. Below 60% is genuinely excellent; institutions in that range have either built significant scale in their overhead structure, operate in markets where loan pricing is strong, or have invested deliberately in fee income streams that carry lower marginal cost. Above 70% requires a specific board-level explanation, because at that level the institution is generating roughly $1 of expense for every $1.43 of revenue, a ratio that limits capital generation and narrows the buffer available to absorb credit losses without eroding earnings.
The efficiency ratio trend over three to five years reveals things the annual snapshot misses. An institution whose efficiency ratio drifted from 62% to 69% over four years while growing assets from $800M to $1.4B is telling a story about expense growth that outran revenue growth, likely reflecting technology investment, talent cost inflation, branch infrastructure, or some combination. The board-level question is whether that investment period is behind the institution or ahead of it, and whether the revenue growth embedded in the current loan and deposit book will close the gap.
A falling efficiency ratio is almost always a positive trend, but context matters. An efficiency ratio improving from 67% to 61% because revenue grew while expenses held flat is strong performance. The same improvement driven primarily by expense cuts in areas like technology maintenance or compliance staffing may be storing up future costs.
Capital Ratios: Operating Buffer vs. Regulatory Floor
The regulatory minimums for well-capitalized status (CET1 at 6.5%, Tier 1 leverage at 5%) tell you where the floor is. They do not tell you where the peer group actually operates, which matters considerably more for strategic planning. The median CET1 ratio for $1B–$10B banks was 13.2% at March 31, 2025 and 13.5% at June 30, 2026; the median Tier 1 leverage ratio was 10.2% at March 31, 2025. An institution at 11% CET1 is not in trouble, but it sits below the peer group’s 25th percentile (11.7% at March 31, 2025), and that position affects the conversation about share repurchases, dividends, branch expansion, and acquisition capacity.
The capital trend chart over eight to twelve quarters shows whether an institution is building capital organically through retained earnings, holding steady through a combination of earnings and distributions, or experiencing gradual erosion. Gradual erosion of 20–30 basis points per quarter may not look alarming in isolation, but over two years it compounds into a materially different capital position.
For institutions with CRE concentrations above the interagency guidance thresholds (CRE loans excluding owner-occupied above 300% of risk-based capital after growth of 50% or more over the prior 36 months, or construction and land development above 100%), the capital buffer story becomes the primary examiner focus. A bank at 320% CRE concentration with 14% CET1 and clean credit metrics is in a very different regulatory conversation than one at 280% with 10.5% CET1 and rising classified assets. The ratio triggers examiner attention; the capital buffer and credit quality data determine how that conversation goes.
Asset Quality Through the Cycle
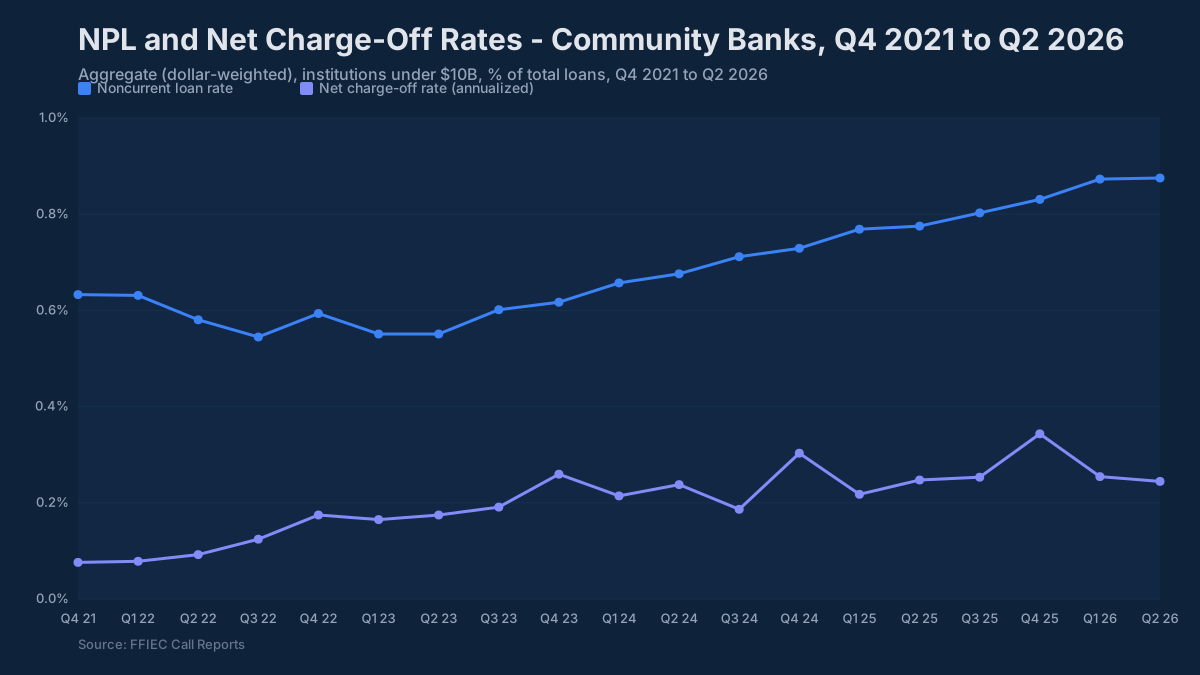
The asset quality outcome for community banks through 2024 was better than the consensus forecast from 2022. The median noncurrent loan ratio (nonaccrual plus 90 days past due, over total loans) for $1B–$10B banks was 0.43% at March 31, 2025 and 0.52% at June 30, 2026 (BankRegReports analysis of Call Report data). Net charge-offs at community banks ran 0.15% annualized in Q1 2025 per the FDIC Quarterly Banking Profile, meaningful normalization from the historically compressed 2021–2022 levels but not the deterioration cycle many had expected when the yield curve inverted and commercial real estate valuations began adjusting.
The stress that did materialize concentrated in specific property types. Office CRE (particularly suburban and secondary-market product) saw the most pronounced valuation and occupancy pressure. Multifamily in markets where construction deliveries peaked in 2023–2024 also showed stress, with rent growth decelerating faster than debt service costs in some geographic markets. Banks with meaningful exposure in either category have been managing criticized and classified loan migration that shows up in the examination classified asset ratio before it fully appears in NPL or charge-off data.
An NPL ratio above 1.5% in the current environment needs a portfolio-level explanation that the board and the examiner can follow. Above 2.0% puts the institution among roughly the worst 8% of $1B–$10B banks (8.5% of them were above 2.0% at June 30, 2026). Equally important is the allowance coverage ratio, allowance dollars as a percentage of non-performing loans. An institution with a 1.8% NPL ratio and 115% allowance coverage is carrying a meaningful reserve against those exposures. One at 1.2% NPLs and 60% coverage has a different conversation to prepare for.
Post-CECL transition, allowance-to-loans ratios for community banks with balanced portfolios have settled in the 1.1–1.4% range. The shift from incurred loss to lifetime expected loss accounting pushed reserves higher when it was adopted, and most institutions in the current environment are holding rather than releasing reserves, a departure from the 2021 pattern when charge-off outperformance drove significant reserve releases and elevated earnings.
What Do the Four Trends Say Together?
Reading the NIM trend, efficiency ratio trajectory, capital buffer position, and asset quality metrics together is what the ALCO and credit committee packages are supposed to accomplish, not as isolated slides but as a connected picture of where the institution sits in the cycle and where the risks and opportunities are concentrated.
The institutions that get the most from this exercise are the ones that put peer benchmarks next to their own trends rather than showing internal data in isolation. A NIM of 3.35% looks different depending on whether the peer group median is 3.28% or 3.55%. An efficiency ratio of 63% carries a different strategic implication if the institution is gaining on the peer group versus holding steady while peers improve.
You can pull the peer comparisons described in this post directly from the BankRegReports platform: search by institution name or FDIC certificate number, select a peer group by asset tier, charter class, or geography, and pull the side-by-side metrics without any data preparation on your end. On the Pro plan, the export to Excel drops the data into a format you can bring directly into the ALCO template.
The ratio most often discovered to be out of position when management teams run this exercise is the efficiency ratio, and that discovery tends to reframe the capital planning and investment conversation in ways that a multi-year internal trend chart alone does not. That is the conversation worth having before the next strategic planning cycle, not after it.
The benchmarks and peer data referenced in this post are available through the BankRegReports platform, no data engineering required. Search any FDIC-insured bank, pull peer group comparisons, and, on the Pro plan, export to Excel for your ALCO package or board presentation.