FDIC Summary of Deposits: Branch Market Share Analysis
Every June 30, the FDIC takes a branch-level snapshot of deposit balances at every insured institution in the country.
Every June 30, the FDIC takes a branch-level snapshot of deposit balances at every insured institution in the country. The resulting dataset, the FDIC Summary of Deposits, is the definitive source for deposit market share analysis, competitive positioning studies, and the branch network benchmarks that show up in ALCO packages, board presentations, and regulatory applications. It is also one of the most underused data sources at community banks, largely because working with the raw files has historically been a manual, error-prone exercise. That is changing, and the competitive intelligence available to CFOs and chief deposit officers who actually use this data is considerable. The official source is the FDIC.

What Does the FDIC Summary of Deposits Actually Measure?
The dataset covers every FDIC-insured institution at the branch level: branch address, FIPS geography (state, county, MSA code, census tract), deposit balances attributed to each location, and branch type codes that distinguish main offices from full-service branches and limited-service facilities. Institution-level summaries reconcile to the deposit totals in your Call Report, so if you have ever wondered why your FDIC-reported deposit figure looks slightly different from your RC-E schedule balance, the reconciliation methodology is documented in the survey instructions.
What the Summary of Deposits does not tell you is deposit composition, maturity, or cost. For that you need FFIEC Call Report schedules (RC-E for deposit type breakdown, RI for interest expense) layered on top. The most useful competitive analyses combine branch-level market share from the Summary of Deposits with cost-of-funds data from the Call Report, giving you a picture of not just who holds the deposits but who is holding them cheaply.
Deposit Market Share: What the Numbers Actually Look Like
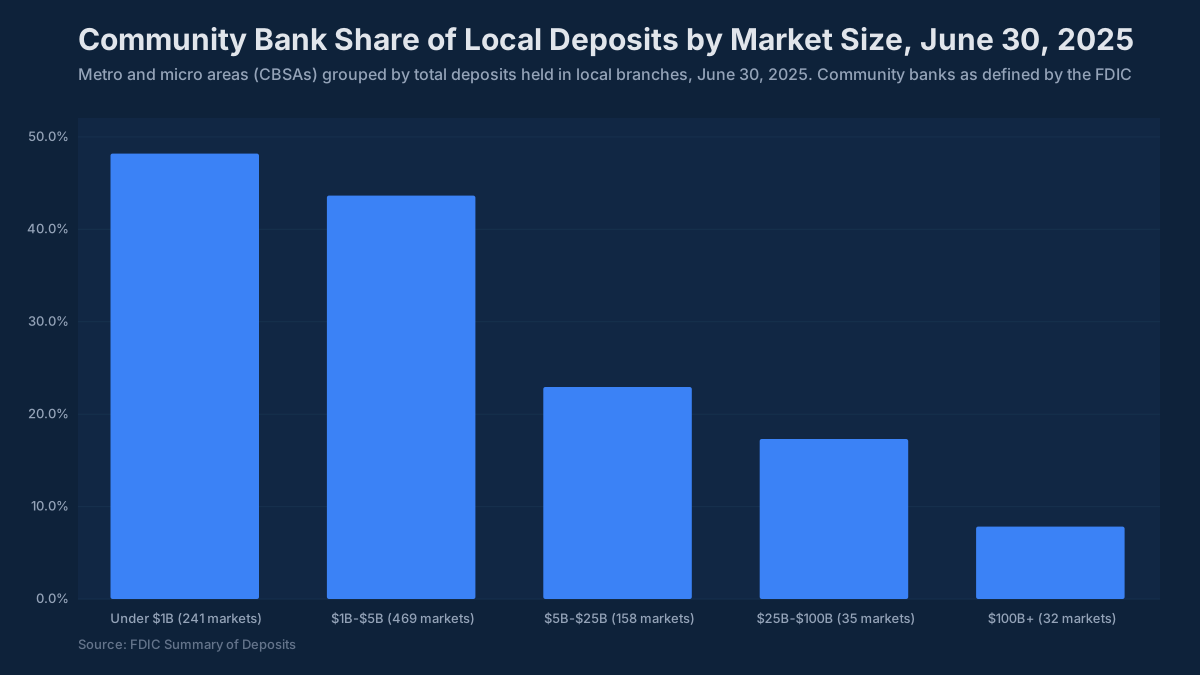
Community banks make up the large majority of U.S. institutions by count but hold a much smaller share of deposits by dollar volume, since the top four banks alone account for over 30% of all deposits nationally. Within individual markets, the picture is often inverted. In rural and smaller metro markets, a well-positioned community bank may hold 20–35% of local deposits, a franchise position that is defensible and that larger institutions find difficult to replicate through branch presence alone.
The Herfindahl-Hirschman Index (HHI) is the standard concentration measure regulators use in merger reviews. Under the HHI bands long used in bank merger screening (the DOJ’s 1982 bands, which the 1995 bank merger screening guidelines build on), an HHI below 1,000 indicates an unconcentrated market, 1,000–1,800 is moderately concentrated, and above 1,800 is highly concentrated. DOJ and banking regulators screen proposed acquisitions against the post-merger HHI and the change in HHI. A transaction that leaves a market above 1,800 and adds more than 200 points will draw scrutiny and may require divestitures. If your institution is evaluating an acquisition or a branch purchase, running this calculation before you announce is not optional.
For the institution doing the analysis rather than the transaction, deposit HHI tells you something about pricing power. Banks in highly concentrated markets tend to exhibit lower deposit betas, holding rates lower during the 2022–2023 hiking cycle and are retaining deposits at lower rates now. Community banks in competitive urban markets, by contrast, saw cumulative deposit betas in the 50–65% range during the hike cycle, meaningfully above the 35–55% median for the peer group.
Branch Efficiency: The Metric ALCO Should Be Tracking
Deposits per branch is one of the cleaner efficiency benchmarks available from public data. The national average for community banks in the $300M–$3B asset range runs roughly $50–$80 million in deposits per full-service branch, but the distribution is wide. Urban branches in competitive markets often carry $90–$120 million. Rural branches in smaller markets may carry $25–$40 million but serve a franchise role that purely financial metrics understate.
The more telling trend is what has happened to deposits per branch over the past five years. The 2020–2022 period brought an unusual deposit surge: stimulus-related inflows pushed average branch deposits up 30–40% at many community banks. Those balances have since partially run off as rates rose and customers moved funds to higher-yielding alternatives. Banks that added branches during the surge and are now managing higher overhead against a smaller deposit base face the most difficult rationalization decisions.
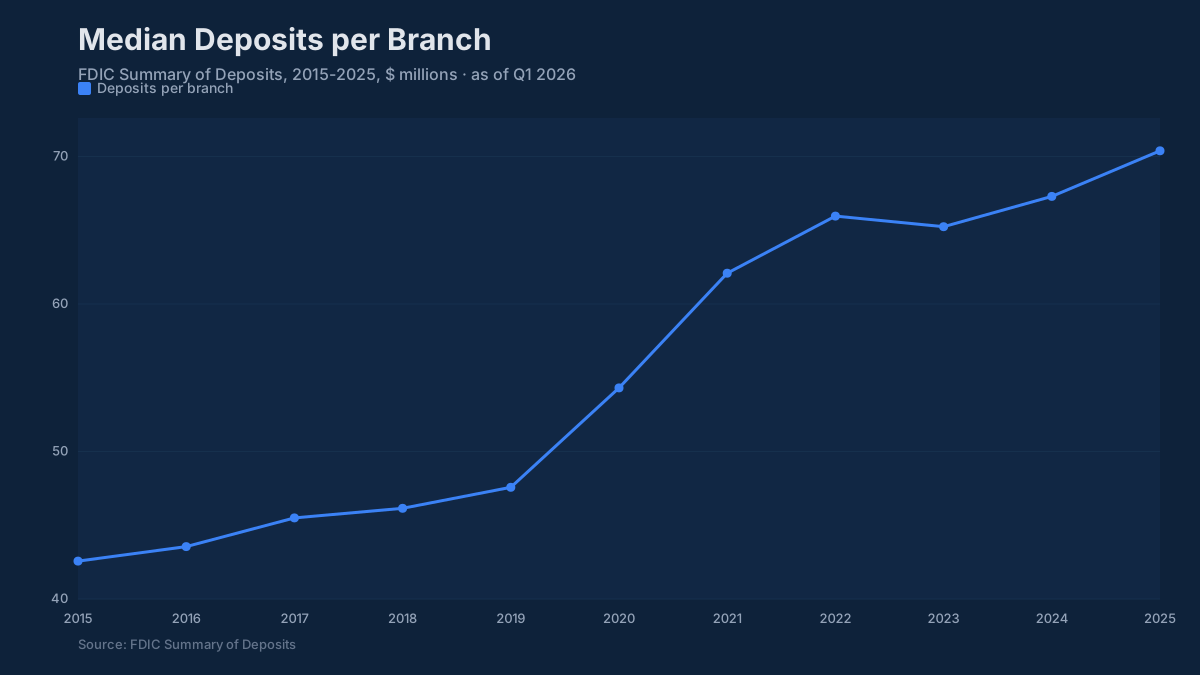
When a bank’s deposits per branch drops below $35 million in an urban or suburban market, that is a figure that tends to appear in examiner discussions about overhead efficiency and the sustainability of the branch model. It will also show up in an efficiency ratio that is pushing above 70%, since branch overhead (occupancy, staffing, technology per location) does not compress easily or quickly.
What Examiners Look For
The Summary of Deposits feeds into several regulatory processes beyond merger review. Examiners use geographic deposit concentration data when assessing liquidity risk, specifically whether an institution’s deposit base is geographically diversified or heavily dependent on a single market or a single large depositor. A bank with 70% of its deposits in one county and that county experiencing meaningful economic stress is a different risk profile than one with deposits spread across three or four markets.
CRA assessment area definitions are derived directly from where a bank takes deposits and makes loans. The branch locations and deposit volumes in the Summary of Deposits form the factual basis for how examiners define your assessment area and evaluate your lending distribution within it. Banks preparing for CRA exams should reconcile their internal branch data against the FDIC file annually, since discrepancies in reported branch status or deposit attribution can affect how the assessment area gets drawn.
For liquidity purposes under the CAMELS framework, examiners will look at uninsured deposit concentration alongside the geographic picture. Institutions with large commercial depositors (municipal deposits, title company escrow accounts, corporate treasury relationships) carry funding concentration risk even if the total deposit base looks stable. The Summary of Deposits does not break out insured versus uninsured balances at the branch level, but your internal data does, and it is worth overlaying the two views when you are building the liquidity section of your ALCO package.
Competitive Intelligence for the ALCO Package
The most practical use of the Summary of Deposits for a community bank CFO is building a clear picture of how your deposit franchise stacks up within your specific markets, not against national averages, but against the actual institutions competing for the same customers.
Start with your primary market definition: the counties or MSAs where you originate meaningful deposit volume. Pull the Summary of Deposits data for those geographies and rank every institution by total deposits. Note which competitors have been gaining share and which have been losing it over the past three to five years. A competitor that has been consistently adding deposits per branch while rationalizing locations is probably doing something right on product, pricing, or relationship management. A competitor with flat or declining share despite branch additions may be creating acquisition opportunity.
Pair this with Call Report cost-of-funds data for the same institutions. The combination of market share trajectory and relative deposit cost is the competitive intelligence that belongs in your ALCO deck, not as a curiosity, but as context for your own pricing decisions. If your two largest competitors are holding core deposit rates 15 basis points below yours while maintaining share, the data is telling you something about your competitive position that internal metrics alone cannot surface.
You can pull the peer-level Summary of Deposits data and the underlying Call Report financials directly through the BankRegReports platform, and both are available without any data wrangling or file downloads. Search by institution, peer group, or geography, pull the deposit market share and branch efficiency metrics alongside the Call Report cost-of-funds data, and export to Excel. The cross-source join, branch deposits from the Summary of Deposits against cost-of-funds from the Call Report, is already built into the platform, so you are working with a combined view from the start rather than reconciling two separate files.
The Noninterest-Bearing Deposit Question
One dimension of deposit franchise quality that is not in the Summary of Deposits but belongs in any serious market share analysis is DDA mix. The percentage of total deposits held in noninterest-bearing checking accounts varied enormously across community banks heading into the rate cycle. Banks with strong commercial relationships and active treasury management practices held 30–40% of deposits in DDA. Consumer-oriented institutions and those without deep commercial banking capabilities were often at 15–20%.
During the 2022–2023 hiking cycle, DDA accounts migrated to interest-bearing alternatives at a pace that caught many community bank ALCO committees off guard. The institutions with the most stable deposit costs through the cycle were generally those that either had exceptional DDA franchises before rates rose or had diversified funding bases that included brokered or wholesale sources they could deploy strategically. For the institutions now assessing their deposit franchise for the next rate cycle, the branch-level geographic data from the Summary of Deposits is a useful starting point, but the DDA composition and repricing behavior data in the Call Report is where the real cost-of-funding story lives.
The branch network you have built and where you have built it shapes what deposit mix is realistically available to you. That is a multi-year strategic constraint, which is why the Summary of Deposits data matters not just for the current ALCO package but for the three-to-five-year strategic plan.
The benchmarks and peer data referenced in this post are available through the BankRegReports platform, no data engineering required. Search any FDIC-insured bank, pull peer group comparisons, and, on the Pro plan, export to Excel for your ALCO package or board presentation.