
Independent bank data for audit and valuation work.

CECL peer data, the full liability stack from deposits to subordinated debt, securities marks, and a source code for every figure.

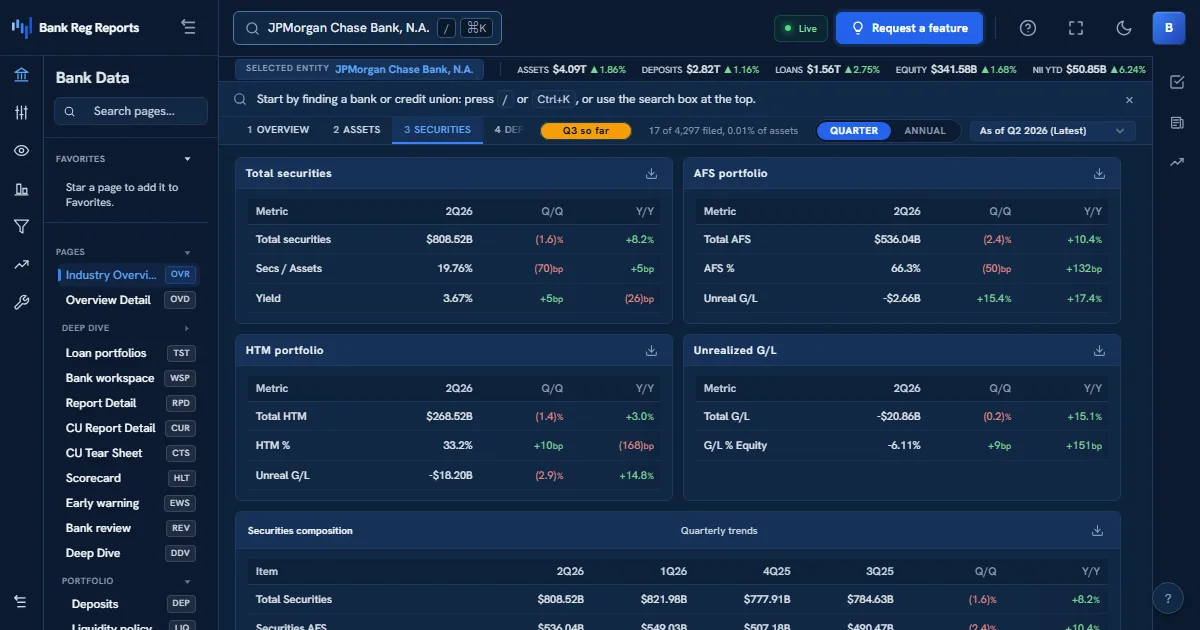
BankRegReports securities view showing available-for-sale and held-to-maturity portfolios, unrealized gains and losses, and a securities trend for a bank.

An auditor testing a bank's allowance, or a valuation team marking a bank's subordinated note, needs figures that come from the filing, not from management's deck. BankRegReports gives both teams peer loss and reserve data for CECL work, every bank's liabilities in seniority order with its subordinated debt and trust preferred balances, its securities at amortized cost and fair value, and the MDRM code behind each number so it can be traced to the call report.

The challenge

  • Challenging a client's CECL qualitative factors needs peer loss history that is slow to assemble by hand.
  • Subordinated debt, trust preferred and FHLB borrowings sit in different call report schedules.
  • Every figure in a work paper or valuation memo has to trace back to a line in the regulatory filing.

How BankRegReports helps

CECL peer data

Historical charge-off and reserve rates by loan category, peer reserve coverage, and the CECL solver for building an allowance estimate from loss history, so qualitative-factor assumptions can be tested against peers.

Open the CECL solver (sign-in required) →

The capital stack, in seniority order

Deposits, FHLB advances, other borrowings, subordinated notes and trust preferred securities ranked by seniority, with memo items and the maturity ladder, for any bank or holding company.

See the debt stack (sign-in required) →

Figures traced to their source filings

Each glossary metric links to its formula and the call report schedule behind it, and the code finder resolves any MDRM code to its line, so a number in a work paper reconciles to the filing.

Find a call report code →

How auditors and valuation analysts put it to work

Typical workflows, from the first search to a client-ready or board-ready output.

Test a client's CECL loss rates against peers

Management's allowance rests on loss rates and qualitative adjustments. You need independent evidence of what similar banks have actually charged off and reserved.

  1. Open the client bank and its standard peer group.
  2. Compare net charge-off and reserve rates by loan category over several years.
  3. Use the CECL solver to see how peer loss history moves the estimate.

Document an issuer's capital stack for a valuation

You are valuing a bank's subordinated note and need its seniority, the debt ranking ahead of it, and the issuer's capital and credit quality against peers.

  1. Open the debt stack to read liabilities in seniority order with maturities.
  2. Pull capital ratios and asset quality against peers of the same size.
  3. Cite the call report schedule for each balance in the valuation memo.

Reconcile a work paper figure to the call report

A reviewer asks where a number came from. You trace it from the metric to its formula, to its MDRM codes, to the line in the filing.

  1. Open the metric's glossary entry for its formula and source schedule.
  2. Resolve each MDRM code in the call report code finder.
  3. Attach the schedule and line references to the work paper.

Frequently asked questions

Can I use BankRegReports to support a CECL audit?

Yes, as independent peer evidence. The platform shows historical net charge-off and reserve rates by loan category for any bank and its peers, which is the comparison auditors use to test management's loss rates and qualitative factors. The allowance itself remains the bank's estimate and your judgment.

Do you provide credit spreads or a pricing reference for bank debt?

No. BankRegReports covers what banks report to regulators: subordinated debt and trust preferred balances, maturities, capital ratios and credit quality. It does not carry traded spreads or a mark for a specific security. Valuation teams use our data for the issuer's fundamentals and peer set, alongside their own pricing sources.

Where do the securities fair values come from?

From the bank's call report: Schedule RC-B reports amortized cost and fair value for held-to-maturity and available-for-sale securities, and Schedule RC-Q reports the fair value hierarchy for banks that file it. The securities view shows the unrealized gain or loss by portfolio and its trend.

How do I trace a figure back to the filing?

Every metric has a glossary entry with its formula and source schedule, and the call report code finder resolves an MDRM code (such as RCON2170, total assets) to its line and description. Each bank page also links to the institution's record at the FDIC and the FFIEC.
See it on your bank

Every FDIC-insured institution, 26+ years of standardized data, one search away.