Community Bank Peer Benchmarks for ALCO and Exam Prep
This is the benchmark companion to Bank Peer Group Analysis: A Step-by-Step Guide. That post explains the mechanics. This one gives the community bank numbers, as of Q1 2025, metric …
This is the benchmark companion to Bank Peer Group Analysis: A Step-by-Step Guide. That post explains the mechanics. This one gives the community bank numbers, as of Q1 2025, metric by metric, and the workflow for turning them into an ALCO package and an exam-ready peer group.
Walk into any community bank ALCO meeting and somewhere on the agenda is a peer comparison slide. More often than not, it is a table pulled from the UBPR PDF: eight or ten ratios, a handful of banks, no trend lines, and a peer group that was last revisited two years ago when the CFO joined. The numbers are technically accurate. They are also nearly useless for anything beyond a checkbox. Building a peer group that actually informs decisions requires more than accepting the FFIEC’s default groupings, and getting that right is worth the effort before your next exam cycle.
Why Are the FFIEC Peer Groups Only a Starting Point for Community Bank Peer Group Analysis?
The UBPR assigns every commercial bank to one of 17 peer groups based on asset size alone (since February 26, 2026; before that, office count and metro location also mattered for banks under $300 million). For a $700 million commercial bank in a mid-sized Southern market, the default peer group is every commercial bank between $300 million and $1 billion, which can include metro banks with brokered deposit programs and de novo institutions still burning through start-up losses. None of those make useful comparisons for your NIM discussion or your CRE concentration conversation with examiners.
The FFIEC designed those peer groups for broad supervisory consistency, not for the kind of strategic analysis a CFO or treasurer is trying to do. That distinction matters when you are building the narrative around why your efficiency ratio landed at 68% or why your deposit beta came in 15 points below the peer median.
Examiners understand this. They use UBPR peer groups as a first screen, but experienced examination teams will ask what your management-defined peer group looks like and whether your self-assessment is grounded in comparable institutions. Coming in with a documented, defensible custom peer group (filtered on asset size, geography, loan mix, and funding model) demonstrates a level of analytical discipline that examiners notice.
 by bank asset-size band, 2002 to 2025](/static/blog/figures/fdic_nim_by_asset_size.svg)
The Metrics That Matter Most and Where Community Banks Stand
Before you can benchmark, you need a reference point. The numbers below reflect FFIEC Call Report and UBPR data as of Q1 2025, so refresh them against the latest quarter before using them in a board package; the official source is the FFIEC.
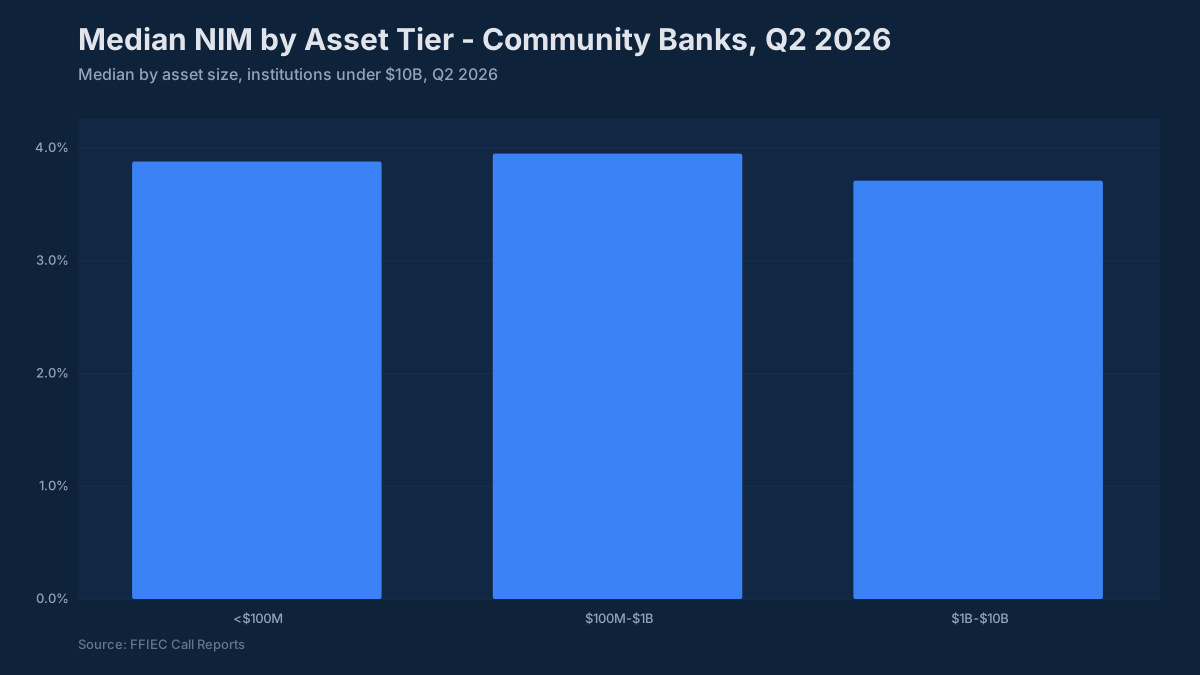
Net Interest Margin. Community bank NIM averaged roughly 3.3–3.5% in Q1 2025, after a period of compression driven by the lagged repricing of deposits that many ALCO models underestimated. Banks that locked in long-duration fixed-rate loans during 2020–2021 felt that compression most acutely. NIM below 3.0% warrants a detailed explanation to the board and is likely an examiner point of focus.
Return on Assets. The typical range for a well-run community bank runs 0.95% to 1.10%. ROA above 1.20% is genuinely strong and puts a bank in the upper quartile of most peer groups. ROA below 0.80% raises questions about earnings sustainability, particularly if it reflects margin compression rather than a deliberate investment in growth.
Efficiency Ratio. The 60–65% range is where most healthy community banks cluster. Below 60% reflects real operating leverage, either excellent revenue generation, disciplined cost control, or both. Above 70% requires an explanation, whether that is a branch consolidation underway, a technology investment cycle, or a revenue mix problem. Boards increasingly watch this number quarter over quarter.
Capital Ratios. Community bank median CET1 sits around 13%, well above the 6.5% well-capitalized minimum. Banks below 10% CET1 are not in trouble, but they have less buffer for credit stress or growth without raising capital. Banks above 16% are often fielding questions from investors or shareholders about capital deployment.
Asset Quality. Non-performing loans as a percentage of total loans ran about 0.4–0.5% at the median community bank in Q1 2025. Above 2.0%, you are in examiner focus territory regardless of what your peers look like. Net charge-offs at community banks ran 0.15% annualized in Q1 2025, matching the pre-pandemic average, per the FDIC Quarterly Banking Profile. The industry-wide rate was materially higher at 0.67%, reflecting credit card losses concentrated at the largest banks, so do not benchmark a community bank against the industry figure. Anything above 0.75% consistently is a trend worth explaining proactively.
Loan-to-Deposit Ratio. The 70–80% range is comfortable. Above 90%, liquidity examiners will ask about your contingency funding plan and wholesale funding reliance. Well below 60% often signals an opportunity cost problem: too much cash sitting in low-yield assets.
CRE Concentration. The interagency guidance screens banks at 300% of total risk-based capital for total CRE, when the portfolio has also grown 50% or more over the prior 36 months, and at 100% for construction and land development. These are not limits, but meeting either screen brings heightened supervisory attention and a documented management framework expectation. Peer context is useful here: if 45% of your peer group is above 300%, the examiner conversation is different than if you are the only one.
Deposit Beta (2022–2024 Cycle). Community banks averaged deposit betas in the 35–55% range through the Fed’s 525-basis-point tightening cycle. That was lower than most ALCO models projected going in, which is why NIM held up through 2022 and into early 2023 before the delayed repricing hit. Banks with higher retail deposit concentrations and lower reliance on money market and brokered products saw betas at the lower end of that range.
Building a Peer Group That Holds Up in an Exam
A defensible custom peer group starts with written criteria. The filters that most management teams find most useful are asset size (typically plus or minus 50% of your own total assets), geographic market type (rural, suburban, or metro), loan mix concentration (commercial real estate heavy vs. C&I vs. consumer), and funding model (core deposit funded vs. wholesale reliant). You do not need all four, but you need enough to explain why the banks on your list are genuinely comparable.
For ALCO, the goal is a group of 15 to 30 institutions where you can tell a coherent story about why deviations from the median are meaningful. A peer group of 8 banks is too thin for statistical credibility. A peer group of 80 banks is probably not a genuine peer group; it is a sector average.
Update the group at least annually. Banks get acquired, grow into different tiers, or change their business model materially. A peer group that made sense in 2022 may not reflect your competitive environment in 2026.
What the Board Wants vs. What Management Tracks
Management teams tend to track peer ratios at a granular level: NIM broken into yield on loans, cost of funds, and earning asset mix; efficiency broken into FTE count per asset dollar and non-interest income offset ratios. That granularity is appropriate for management decision-making.
Boards want a shorter story. Three to five ratios, trend over six to eight quarters, clear language about whether performance is improving or deteriorating relative to peers, and a specific action if a metric is outside the acceptable range. A board member who sees an efficiency ratio at 67% wants to know whether that is better or worse than it was a year ago, where it sits in the peer distribution, and what management is doing about it, not a 12-row table of sub-components.
The single most useful format for board peer analysis is a trend line for your institution overlaid on the peer 25th–75th percentile band. If your NIM is inside the band and moving in the right direction, one sentence covers it. If it has dropped below the 25th percentile for two consecutive quarters, that is the conversation, not the data format.
Putting It Together for the ALCO Package
You can pull peer benchmarks directly from the BankRegReports platform without building a data pipeline or waiting on a vendor extract. Search any FDIC-insured bank, filter by asset size and geography, pull the UBPR ratios you care about across eight quarters, and, on the Pro plan, export to Excel. The ALCO package data you need takes about twenty minutes, not a week.
The platform covers FFIEC Call Reports, UBPR, FDIC institutional data, Federal Reserve NIC and Y-9C holding company filings, and NCUA 5300 credit union data, all normalized to consistent units and time-aligned across quarters. The unit normalization alone saves a meaningful amount of cleanup: Call Report data is reported in thousands, NCUA data is in whole dollars, and the two can be joined correctly without manual adjustment.
The data that feeds the web platform is the same data exposed through the API, so the numbers are consistent whether you pull them interactively or extract them.
One practical note for exam preparation: if you have a specialized business model (significant SBA loan production, agricultural concentration, heavy reliance on municipal deposits), consider building separate peer groups for different metrics. Your NIM peer group may not be the right comparison for your CRE concentration analysis. Examiners understand this segmentation when it is explained clearly.
The banks that handle peer benchmarking best treat it as a living analytical process, not a quarterly document production exercise. The peer group definition, the metric selection, and the management response thresholds should all be written down, reviewed annually, and owned by someone with enough authority to act on what the data shows. That combination of current data, defensible methodology, and clear escalation is what turns a peer comparison slide into a tool the board and examiners actually trust.
The benchmarks and peer data referenced in this post are available through the BankRegReports platform. No data engineering required. Search any FDIC-insured bank, pull peer group comparisons, and, on the Pro plan, export to Excel for your ALCO package or board presentation.