Call Report Schedule RC Explained: Balance Sheet Line Items
If you have spent time building bank models, preparing for regulatory exams, or reconciling regulatory filings against financial statements, you already know that Schedule RC is where the story starts. …
If you have spent time building bank models, preparing for regulatory exams, or reconciling regulatory filings against financial statements, you already know that Schedule RC is where the story starts. It is the consolidated balance sheet at the heart of every FFIEC Call Report. Get it right and the rest of the filing flows logically. Get it wrong and you will spend hours chasing rounding differences and form-variant quirks that have no documentation anywhere a normal person would look.
What Is Schedule RC?
Schedule RC is the consolidated balance sheet submitted as part of the FFIEC Call Report (FFIEC 031 for banks with foreign offices or $100 billion or more in total assets, FFIEC 041 for other domestic-only filers, and the streamlined FFIEC 051 for domestic-only banks under $5 billion that elect it). Banks file it quarterly with their primary federal regulator (OCC, Federal Reserve, or FDIC), and the data flows into the FFIEC’s Central Data Repository (CDR), which is where the public bulk files originate; the official source is the FFIEC.
The schedule follows a fairly intuitive structure: assets on one side, liabilities and equity on the other. But the devil is in the detail codes. Each line item is identified by an MDRM code (a four-character alphabetic mnemonic followed by a four-character item number, usually digits but sometimes letters, as in 2170 or B530) that maps to a precise regulatory definition. RCFD2170, for instance, is total assets. RCFD3210 is total equity capital. These codes are the lingua franca of bank regulatory analysis, and misreading one can silently corrupt a model for years.
One note on prefixes before you pull anything. The same call report item carries a different prefix depending on which form the bank files. FFIEC 041 and 051 filers report RCON, for domestic offices. FFIEC 031 filers report RCFD on a consolidated basis, and RCFN for foreign offices, so total deposits for an 031 filer is RCON2200 plus RCFN2200 rather than RCON2200 alone. Schedule RC-R Part I (regulatory capital and the capital ratios) moved off RCON with the Basel III revisions of 2014 and 2015 and now uses RCOA on the 041 and 051 and RCFA on the 031; Part II (risk-weighted assets) still reports under RCON and RCFD. Query a single prefix and you will silently drop a whole population rather than get an error, and for an RCON-only query that population is the largest banks in the country.
Why RC Matters More Than the Published Financial Statements
For large banks, the 10-K and the Call Report will tell approximately the same story. For community banks and mid-size regionals, they will not. Holding company structures, minority interests, intercompany eliminations, and different accounting consolidation scopes create real differences. When you are stress-testing a bank or building a peer comparison, you want the regulatory balance sheet, not the investor relations version.
ALCO teams at banks use Schedule RC as their starting point for every interest rate risk model. Examiners use it as the anchor for asset quality and capital adequacy reviews. If your analysis diverges from what the examiners are looking at, you will not understand the regulatory pressure the bank is operating under.
Key Line Items in Schedule RC
Here is a practitioner’s map of the sections that matter most for credit analysis, rate risk, and capital work.
Assets
Cash and Balances Due From Depository Institutions (RCFD0081, RCFD0071): This splits between interest-bearing and non-interest-bearing balances. The mix matters for NIM modeling: idle cash earns nothing and growing balances often signal caution or limited deployment capacity.
Securities (RCFD1754, RCFD1773): Held-to-maturity and available-for-sale are carried on separate lines. After the 2022–2024 rate shock hammered AFS portfolios, the HTM/AFS split became a first-order concern for anyone looking at AOCI and tangible book value.
Loans and Leases (RCFD2122, net of RCFD3123 for allowance): This is the core earning asset for most banks. RC breaks loans into held-for-investment and held-for-sale. The gross amount, allowance, and net figure each appear separately. Do not net them yourself; the MDRM definitions are specific about what goes where.
Premises and Other Real Estate (RCFD2145, RCFD2150): OREO carries real credit signal. A growing OREO balance means the bank is taking deed-in-lieu or foreclosing on collateral, a lagging indicator of prior underwriting problems.
Total Assets (RCFD2170): The headline number. Used to define asset tiers, peer groups, and capital ratio denominators. Community banks under $10B have materially different regulatory regimes than those above, so this number is regulatory category-defining.
Liabilities
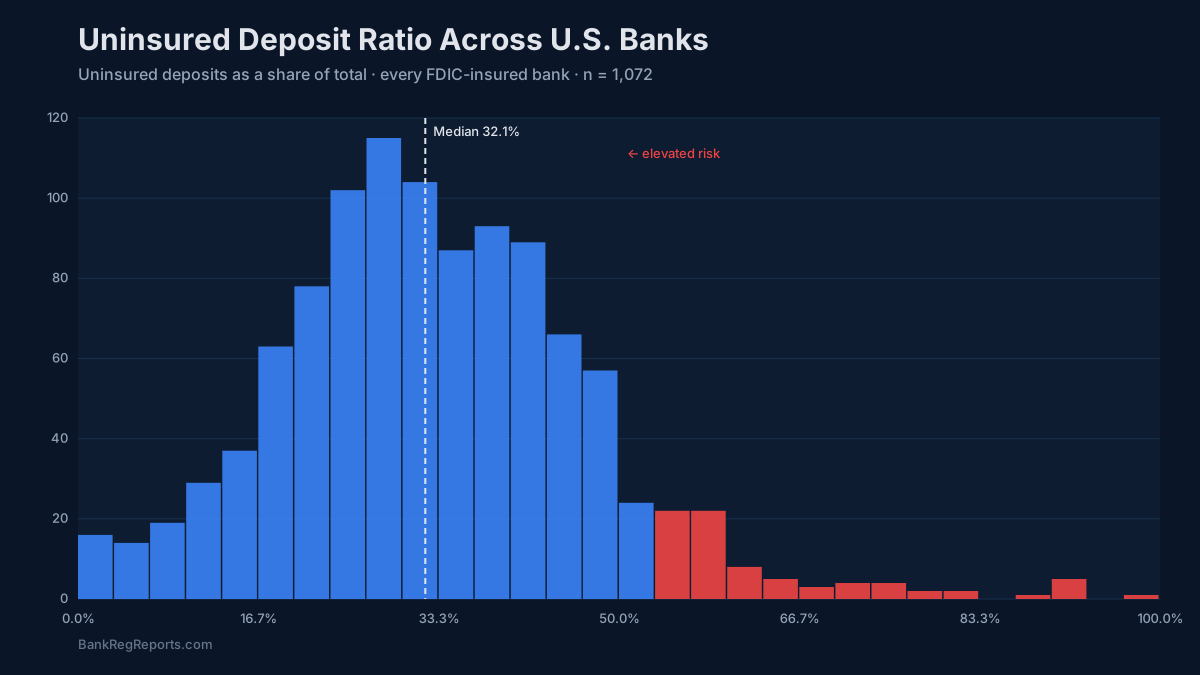
Deposits (RCON2200, RCFN2200): The RC deposit line breaks into domestic offices (RCON2200) and, for FFIEC 031 filers, foreign offices (RCFN2200). Within domestic, Schedule RC-E provides the detail (transaction vs. non-transaction, brokered, etc.), but the RC total is your anchor.
Borrowed Funds: Federal funds purchased in domestic offices (RCONB993), securities sold under agreements to repurchase (RCFDB995), other borrowed money including FHLB advances (broken out in Schedule RC-M), and subordinated debt all appear in the liability section. The composition of wholesale funding tells you a great deal about the bank’s liquidity risk profile and rate sensitivity.
Total Liabilities (RCFD2948): The complement to equity. Changes in this relative to the asset base drive leverage ratios.
Equity Capital
Total Equity Capital (RCFD3210): This is what survives after all liabilities are subtracted. For regulatory capital purposes, you need to bridge from book equity to regulatory capital (Tier 1, CET1) using RC-R, but RC is where you start.
AOCI (RCFDB530; RCONB530 on the 041 and 051): Accumulated other comprehensive income lives inside equity. Unrealized losses on AFS securities flow through AOCI and reduce book equity at every bank, which is why book equity fell so sharply in 2022. What differed was regulatory capital: most community banks made the one-time AOCI opt-out election, so those losses did not reduce their CET1, while the largest banks could not opt out and saw the losses in their regulatory capital as well.
Where Analysts Get Tripped Up
The MDRM system is internally consistent, but it has accumulated decades of revisions, retirements, and form-variant splits. A code that exists on the 031 may not appear on the 051. A code that was live through 2019 may have been retired and replaced. If you are building a time-series model across a peer group that spans different filing forms, you will hit these discontinuities.
The raw bulk files from the CDR compound this. Column naming is inconsistent across vintages. Null handling differs. Some periods ship with restatement amendments that the naive download will miss. Anyone who has tried to build a clean multi-year panel from the raw CDR ZIP files knows exactly how many hours this absorbs.
Enterprise data platforms and legacy financial data providers have solved parts of this problem, but typically at a cost structure that excludes independent analysts, smaller institutions, and fintech teams who need programmatic access without a multi-year contract.
Using RC as an Analytical Foundation
Schedule RC is the anchor, not the endpoint. Once you have clean balance sheet data, the natural extensions are:
- Rate risk: Join to Schedule RC-E for deposit repricing and RC-M for FHLB maturities. Layer in the Federal Reserve H.15 series for rate path scenarios.
- Asset quality: Bridge RC loan totals to RC-N past-due and nonaccrual detail. Calculate NPA ratios that are consistent with how examiners calculate them.
- Capital: Bridge from RC equity to RC-R regulatory capital. Understand AOCI opt-in/opt-out positioning across your peer group.
- Peer benchmarking: UBPR data from BankRegReports provides pre-calculated peer ratios that tie directly to the same MDRM universe as the raw Call Report.
The data infrastructure to do all of this used to require either an enterprise vendor relationship or a significant internal engineering effort. For teams that have built that infrastructure from raw CDR files, the maintenance burden alone (restatements, code retirements, vintage inconsistencies) is substantial.
Getting Started
If you are doing serious bank analysis (credit research, regulatory consulting, ALCO support, fintech underwriting), clean Call Report data is the foundation everything else depends on. BankRegReports was built specifically to solve the normalization problem that every analyst hits when working with raw FFIEC data.
If you have been spending time fighting raw CDR files or working around the gaps in enterprise data platforms, this is worth fifteen minutes of your time.