Deposit Beta Analysis: Measuring Bank Rate Sensitivity
If you have sat through an ALCO meeting in the past few years, you have heard the term "deposit beta" more times than you can count. It became the central …
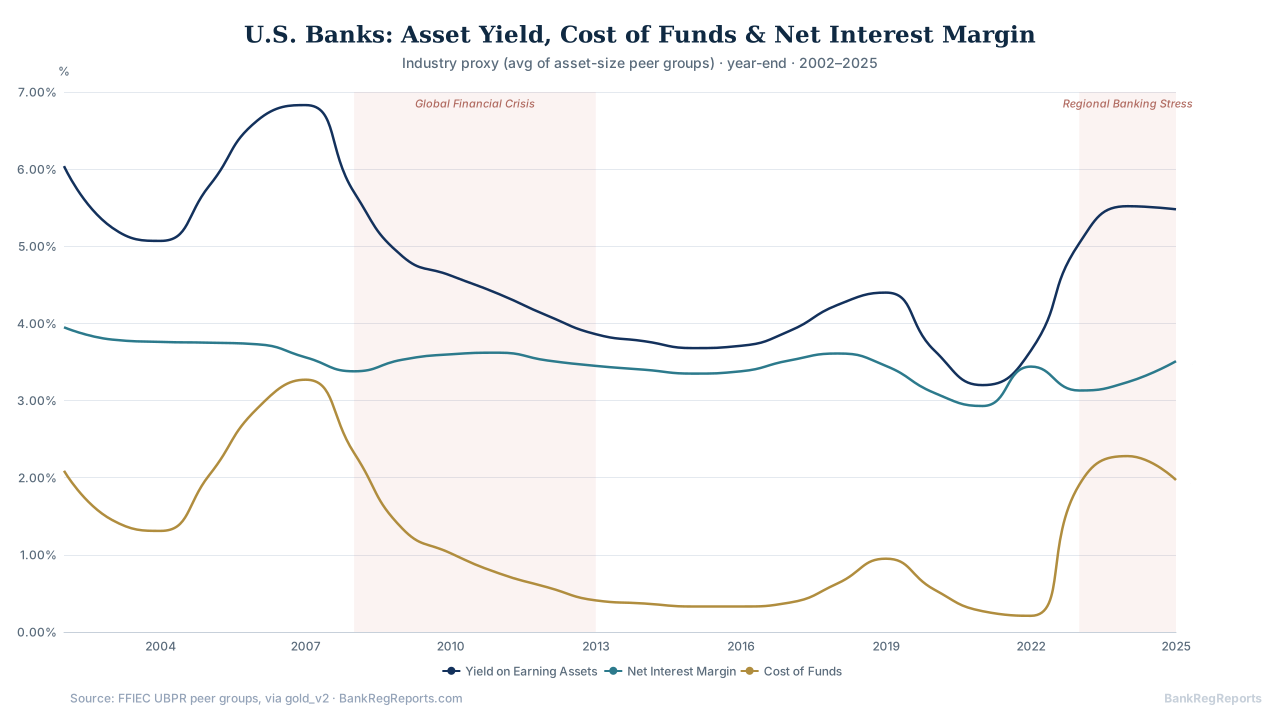
If you have sat through an ALCO meeting in the past few years, you have heard the term “deposit beta” more times than you can count. It became the central question of the 2022–2023 rate cycle: when the Fed moved 525 basis points in roughly 16 months, how much of that actually passed through to depositors? The answer, which varied enormously by institution, deposit mix, and market, is what deposit beta measures.
What Does Deposit Beta Actually Measure?
Deposit beta is the ratio of the change in a bank’s deposit cost to the change in a reference rate, almost always the Fed Funds target rate or SOFR. Formally:
Deposit Beta = ΔCost of Deposits / ΔFed Funds Rate
A deposit beta of 40% means that for every 100 basis points the Fed moved, the bank’s blended deposit cost moved 40 bp. A beta of 0% means deposit costs were effectively inert: all the NIM expansion from rate hikes flowed directly to net interest income.
In practice, you calculate this over a defined window (the hiking cycle, a rolling twelve months, cumulative since liftoff) and you almost always segment it. Retail savings behaves differently from brokered CDs. NOW accounts are stickier than money market sweep accounts. Interest-bearing commercial DDA is its own animal. A single blended beta is a starting point, not a conclusion.
Why It Matters for ALCO and Exam Prep
Asset/Liability committees care about deposit beta for two reasons. First, it is the primary driver of margin compression or expansion in a rate shock scenario. If your IRR model assumes a 30% deposit beta on savings but your actual cumulative beta came in at 65%, your model was wrong in a way that the examiner will find. Second, deposit beta informs funding strategy: whether to lock in wholesale funding, extend CD specials, or let the runoff risk build.
Regulators (OCC, FDIC, and the Fed) scrutinize deposit repricing assumptions heavily after the 2023 bank failures made it clear that deposit beta and deposit duration were systematically underestimated across the industry. If you are going into an exam with IRR model outputs, you need empirical beta support, not just vendor assumption benchmarks.
The problem has always been data. Calculating deposit betas for a peer group, or even for your own institution over multiple cycles, requires clean, time-series cost-of-funds data from regulatory filings. That data exists in FFIEC Call Reports, whose official source is the FFIEC, but anyone who has tried to work with raw CDR files knows the friction involved.
Practical Caveats for Deposit Beta Analysis
A few things that trip up analysts who are new to this work:
Rate annualization matters. The Call Report does not report cost-of-funds rates. It gives year-to-date interest expense in dollars (Schedule RI) and quarterly average balances (Schedule RC-K). Convert the year-to-date expense to a quarterly figure, divide by the average balance and annualize, or use the rate the UBPR computes. Make sure you are comparing apples to apples when you pair them against a Fed Funds rate that may be quoted as a daily effective average for the quarter.
Deposit mix shift contaminates the beta. If a bank’s interest-bearing deposit share increased from 60% to 75% over the cycle because customers moved from non-interest DDA to savings, the blended cost metric will rise even if each deposit category’s beta was low. Segment the analysis by deposit type when the data supports it.
Lag structure. Deposit repricing does not instantaneously respond to Fed moves. Many institutions saw their highest betas in 2023Q2–Q3, well after the bulk of the hiking cycle. A rolling beta calculation captures this better than a simple cumulative figure. Build both.
Vintage of funding matters for holding companies. If you are analyzing a holding company with brokered funding or FHLB advances, the Y-9C filing (available via BankRegReports’ Federal Reserve NIC and Y-9C integration) will give you a more complete picture than the bank-level Call Report alone.
Why Raw Regulatory Data Beats Vendor Summaries
Enterprise data platforms and legacy financial data providers will sell you pre-computed deposit beta benchmarks. Some of them are reasonable. But when you are building an IRR model that regulators will scrutinize, or presenting to an ALCO that wants to understand methodology, pre-computed benchmarks create a documentation problem: you cannot fully explain where the number came from or how the peer group was constructed.
A beta you build yourself from the filed items, with every input traced to its source line and the peer group defined in writing, is what survives an exam. The BankRegReports metric catalog maps standardized names back to their underlying MDRM source codes so your crosswalk is always auditable.
Getting Started
If deposit beta is on your ALCO agenda, or if you are building IRR model validation support, preparing for a regulatory exam, or doing peer benchmarking for a client, the data infrastructure should not be the hard part.
The calculation described above fits in a Jupyter notebook on a free key, no data warehouse required.