Bank Acquisition Pricing: Deal Multiples and Benchmarks
This is the benchmark companion to Bank M&A Analysis: How to Evaluate a Deal from Call Reports. That post is the method. This one is the numbers: where deals are …
This is the benchmark companion to Bank M&A Analysis: How to Evaluate a Deal from Call Reports. That post is the method. This one is the numbers: where deals are pricing, what moves the premium, and the order in which a disciplined buyer screens a target.
Bank acquisition pricing has compressed. In 2024, the median community bank acquisition priced at roughly 1.3x tangible book value, down from the 1.6–1.8x deals that were common in 2019–2021, and well below the 2.0x+ premiums that characterized the pre-financial-crisis M&A boom. That compression tells you something important: buyers have gotten more disciplined, sellers have adjusted expectations (sometimes reluctantly), and the rate environment has permanently changed how acquirers think about deposit franchise value. A deal that penciled at 1.7x tangible book when the target’s cost of funds was 0.20% looks very different when that same book is funded at 1.40% and still climbing.
Community bank M&A is a fundamentally different exercise than acquiring a commercial enterprise. The balance sheet is the product. What you are buying (a branch network, a deposit franchise, a loan portfolio, and a management team) is entirely visible in public regulatory filings long before a banker makes a call or a letter of intent gets signed. The skill is knowing which numbers to look at and in what sequence.

What Drives the Acquisition Premium and Price-to-Book?
Price-to-tangible-book (P/TBV) is the standard community bank M&A metric, but it does not tell you what you need to know on its own. A bank trading at 1.2x tangible book may be cheap or expensive depending entirely on what is inside that book.
The deposit premium is the piece most buyers underestimate. When an acquirer pays 1.4x tangible book for a community bank, they are paying roughly book value for the balance sheet assets and some additional amount, the premium, for the deposit franchise. That deposit franchise value is a function of cost, stability, and mix. A bank with a 0.40% blended cost of deposits in a market where the fed funds rate sat at 5.25–5.50% through most of 2024 has something genuinely scarce. A bank whose deposit costs ran 1.50% during that same window may have strong relationships, but the funding advantage is largely gone.
Deal premiums in 2024–2025 have clustered around a few observable corridors. Whole-bank acquisitions of sub-$500M institutions have priced mostly in the 1.1–1.4x tangible book range. Banks between $500M and $2B with above-average profitability and below-average deposit costs have reached 1.5–1.7x when buyers competed for them. Deals where asset quality uncertainty was high (elevated NPLs, CRE concentrations near or above the 300% interagency guidance threshold, or a loan portfolio with meaningful variable-rate exposure) have generally priced at or below 1.1x, sometimes at discounts to book.
One number that rarely gets discussed but consistently affects pricing: the efficiency ratio trend. A bank running 68% efficiency and heading toward 72% over the past four quarters signals that management has a cost control problem the acquirer will need to solve. A bank at 66% heading toward 62% suggests the opposite: a team that is tightening operations even in a difficult revenue environment. Both sell for different multiples, and the trajectory matters more than the current level.
The Signals Buyers Look For: In Order
A disciplined acquirer runs through a hierarchy of questions before assigning a value to any target. The sequence matters because it determines whether you continue or stop.
Can you acquire it? Before any financial analysis, confirm ownership structure. The Federal Reserve NIC database, accessible through BankRegReports, tells you whether the institution is a mutual holding company subsidiary (structurally very difficult to acquire in most scenarios), a privately held family bank, a publicly traded BHC subsidiary, or an independent. Mutual holding companies represent a hard stop for most acquirers. Spending six weeks building a valuation model on a bank you cannot buy is a common and avoidable mistake.
Is the capital structure clean? The starting point is CET1. The median CET1 ratio for $1B–$10B banks was 13.2% at March 31, 2025, and the middle half of $300M–$3B institutions sat between 12.0% and 16.5%. A bank running 15%+ CET1 with a flat loan book for three or more years often indicates excess capital accumulation, sometimes a sign of a board without a deployment strategy, sometimes a sign of an impending seller. A bank at 10% CET1 with aggressive loan growth tells a different story; the acquirer either accepts the capital dilution or factors a capital raise into the transaction structure.
What does the deposit franchise actually cost? Pull the interest expense on deposits from the income statement relative to average deposit balances; that is the blended deposit cost. Compare it to peer banks in the same asset tier and geography. During the 2022–2024 hiking cycle, community banks averaged a cumulative deposit beta of roughly 35–55%, meaning deposit costs rose 35–55 cents for every dollar of fed funds increase. Banks that came in at the low end of that range, 30% or below, held onto significantly more NIM and, more importantly, demonstrated that their customers were not purely rate-sensitive. That characteristic does not disappear when rates fall. It reflects the quality of the deposit relationship, not just a timing lag.
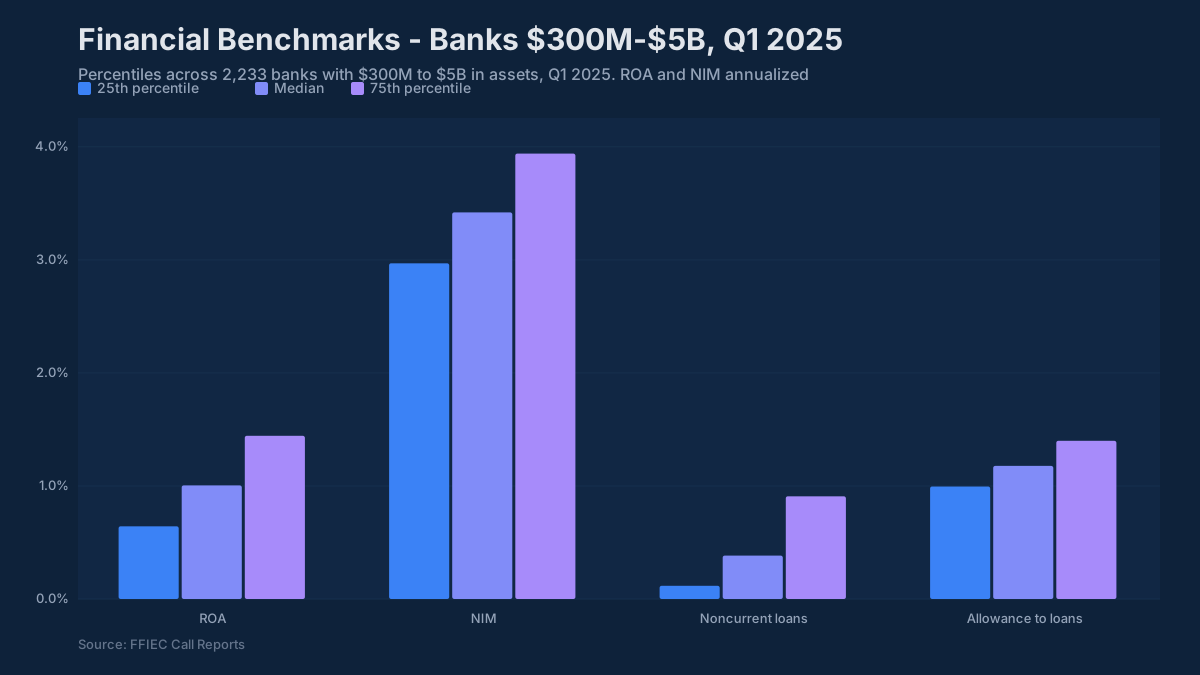
Where is asset quality, and where is it heading? The NPL ratio is a trailing indicator. The median noncurrent loan ratio was 0.43% for $1B–$10B banks and 0.34% for $100M–$1B banks at March 31, 2025, with anything above 2.0% generating examiner focus and anything above 3.0% requiring a workout story in the deal narrative. But the number that deserves equal attention in a pre-close screen is the 30-89 day past due bucket. That figure is the leading indicator: loans in early-stage delinquency today become NPLs in the next one to three quarters. A bank with clean 90+ day numbers but a 30-89 day bucket that has grown 40 basis points over two quarters is telling you something the headline figures are not yet capturing.
Is the income stream real? ROA for community banks averaged 0.95–1.10% in Q1 2025. Strong performers cleared 1.20%; anything below 0.80% warrants a careful look at whether the earnings are structural or dependent on one-time items, gains on sale, or a provision that has been kept artificially low relative to charge-off history. Net charge-offs at community banks ran 0.15% annualized in Q1 2025, matching the pre-pandemic average, per the FDIC Quarterly Banking Profile. The industry-wide rate was materially higher at 0.67%, reflecting credit card losses concentrated at the largest banks, so do not benchmark a community bank against the industry figure. A bank showing a 0.10% NCO rate with a 1.2% NPL ratio and an allowance at 0.80% of loans has a math problem that will surface in due diligence.
Deal Activity Trends: 2024–2025
After a sharp slowdown in 2023 (when rate uncertainty made book value marks difficult to model and buyers pulled back), deal volume began recovering through 2024. Whole-bank transactions in the community banking segment (sub-$10B sellers) totaled roughly 130–150 announcements in 2024, up from approximately 100 in 2023 but still well below the 200-plus deals announced in each of 2018, 2019 and 2021.
Several patterns defined the 2024–2025 cycle. First, succession-driven sellers remain the dominant supply source. The average age of a community bank CEO at institutions below $1B is above 60. Banks that have not developed internal succession candidates are increasingly recognizing that a negotiated sale at a reasonable multiple is a better outcome than a contested management transition. These deals tend to move quickly once the seller is ready, and they often happen without a formal auction.
Second, buyers with proven integration capacity are paying modest premiums over less experienced acquirers. A track record of completed integrations (clean core system conversions, demonstrated cost-save achievement, retention of the target’s commercial relationships) is now a visible differentiator in seller conversations. Sellers at the $300M–$800M size often care as much about what happens to their employees and customers as the final multiple.
Third, CRE concentration is reshaping deal geography in ways that are not obvious from headline numbers. Banks with CRE-to-capital ratios above 300% (the level the interagency guidance pairs with a 36-month growth test to screen for closer review) are finding that acquirers discount their multiples meaningfully, because the acquirer’s own concentration ratio absorbs the target’s exposure. A buyer already running 280% CRE-to-capital acquiring a target at 350% creates a combined entity that will be in front of examiners on concentration management. That risk shows up in the deal price.
What the Examiner Cares About, and What the Board Wants to Know
For banks on the acquiring side, examiners focus on integration risk and capital adequacy post-close. A well-capitalized acquirer that drops to 10% CET1 after a deal closes is managing to minimums, and examiners will want to see a clear capital restoration plan if anything in the loan portfolio surprises. For banks crossing $10B in assets mid-integration, the Durbin interchange cap and CFPB examination authority add another layer of complexity that needs to be modeled before the deal is announced.
Boards of acquiring institutions want to understand the earnings accretion timeline and the tangible book dilution earnback period. The typical expectation for community bank M&A is three to five years of earnback on TBV dilution. Deals stretching beyond five years require either a very compelling strategic rationale or a seller willing to accept a lower multiple to make the accretion math work.
For target boards, the fiduciary question is simpler but no less important: is this the best available outcome for shareholders, depositors, and employees? Having a clear picture of where your own institution sits relative to peer (on NIM, efficiency, deposit cost, and capital) is essential context for evaluating any offer. A bank that believes it is running 63% efficiency against a peer median of 67% should not accept a deal priced as if cost savings are the primary rationale.
Running Your Own M&A Screen
Whether you are building a target list or evaluating your own strategic positioning, the starting point is the same: pull the current quarter snapshot for the peer group that matters to you, and look at the distribution of the metrics that drive deal pricing.
You can pull peer benchmarks directly from the BankRegReports platform: filter by state, asset size range, and charter type, and the platform surfaces the FFIEC Call Report data in a format you can sort and compare. The official source for that Call Report data is the FFIEC. On the Pro plan, export to Excel and you have the foundation of an M&A screening table or a board-level strategic positioning analysis without any data infrastructure work.
The banks that are best positioned in the current M&A environment, whether as buyers or sellers, are the ones that understand their own regulatory profile clearly enough to have that conversation from a position of knowledge rather than reaction. That starts with the same public data every examiner, every investment banker, and every potential acquirer is already looking at.
The benchmarks and peer data referenced in this post are available through the BankRegReports platform. No data engineering required. Search any FDIC-insured bank, pull peer group comparisons, and, on the Pro plan, export to Excel for your ALCO package or board presentation.