
Bank fundamentals, screened and ranked.

Screen 4,187 banks on any metric, rank the leaders and laggards, and pull 26 years of history into your model.

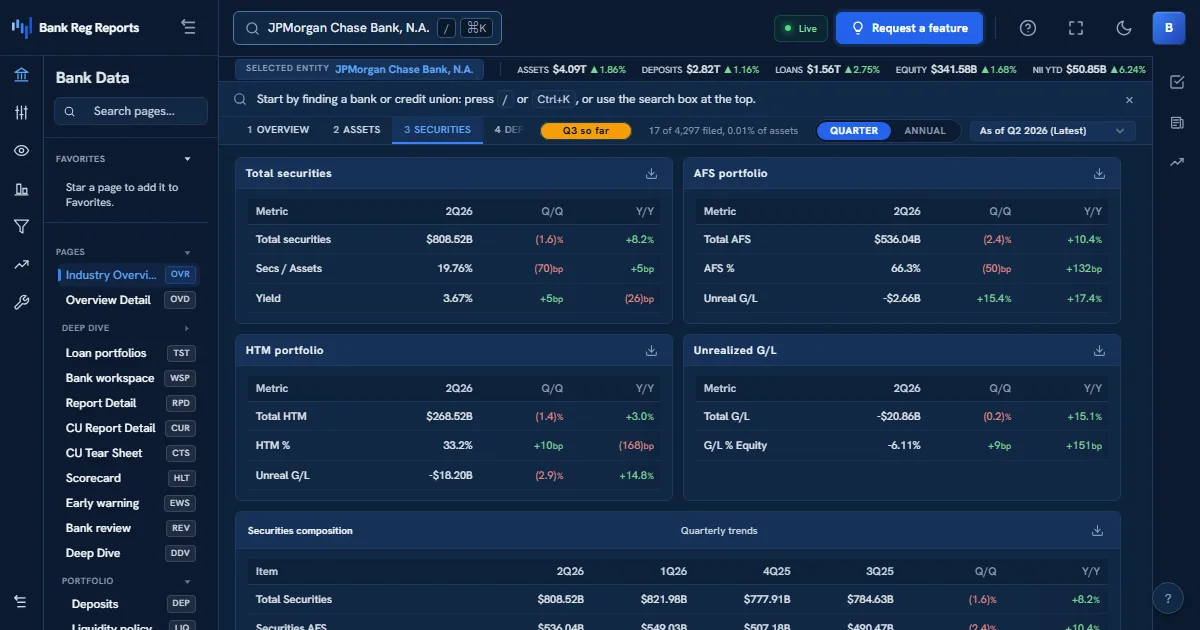
BankRegReports securities view showing AFS and HTM portfolios, unrealized gains and losses, the maturity and repricing ladder, and the unrecognized HTM gain or loss for a bank.

Whether you hold bank equities, trade the sector, or underwrite credit, the edge is in the regulatory data before it reaches the headlines. BankRegReports lets you screen every FDIC-insured bank on the metrics that drive valuation and risk: capital, margins, credit quality, securities marks, and, on the Pro plan, export per-bank history straight into your model.

The challenge

  • Bank fundamentals are scattered across FFIEC files, 10-Ks, and call reports.
  • Screening the whole sector on a single ratio is impractical by hand.
  • Unrealized securities losses (AOCI) hide in schedules most screeners ignore.

How BankRegReports helps

Sector-wide screening

Filter the full universe of banks on capital, profitability, growth, and credit metrics to build a shortlist in seconds.

See pricing →

Leaderboards & rankings

Largest banks, highest CET1, highest Texas Ratio, highest uninsured-deposit share: ranking pages that surface the tails of the distribution.

View rankings →

26 years of history

Standardized quarterly history back to Q1 2000, with per-bank CSV export on the Pro plan, so you can model cycles, not just the latest quarter.

Check data coverage →

How investors put it to work

Typical workflows, from the first search to a client-ready or board-ready output.

Screen the sector for a thesis in seconds

You have a view (thin capital, deposit runoff, heavy CRE) and you need the names that fit it across the whole universe, not a hand-picked watchlist. You screen every bank on the driving factor and rank the tails.

  1. Filter all FDIC-insured banks on capital, credit, funding, or growth metrics.
  2. Rank the shortlist to surface the extremes of the distribution.
  3. Open each name's profile; on the Pro plan, export its metric history to CSV for your model.

Size the unrealized-loss risk on a name

A regional bank looks cheap on book value, but the AOCI and HTM marks may tell a different story. You quantify the duration exposure before it reprices.

  1. Open the securities view for AFS versus HTM and the unrecognized HTM gain or loss.
  2. Read the maturity-and-repricing ladder for interest-rate sensitivity.
  3. Compare the mark against tangible common equity to gauge the real cushion.

Pull a full-cycle history into your model

Your model needs consistent quarterly panels across a full credit cycle, not a single snapshot that breaks when a line item drifts. On the Pro plan, you export standardized history straight into your environment.

  1. Open a bank's profile and select the metrics you need.
  2. On the Pro plan, export its standardized quarterly history to CSV.
  3. Check each field's glossary definition for breaks, such as CECL adoption, before you join it.

See it in action

The same views you'll work in, on real FDIC-insured banks, refreshed every quarter.

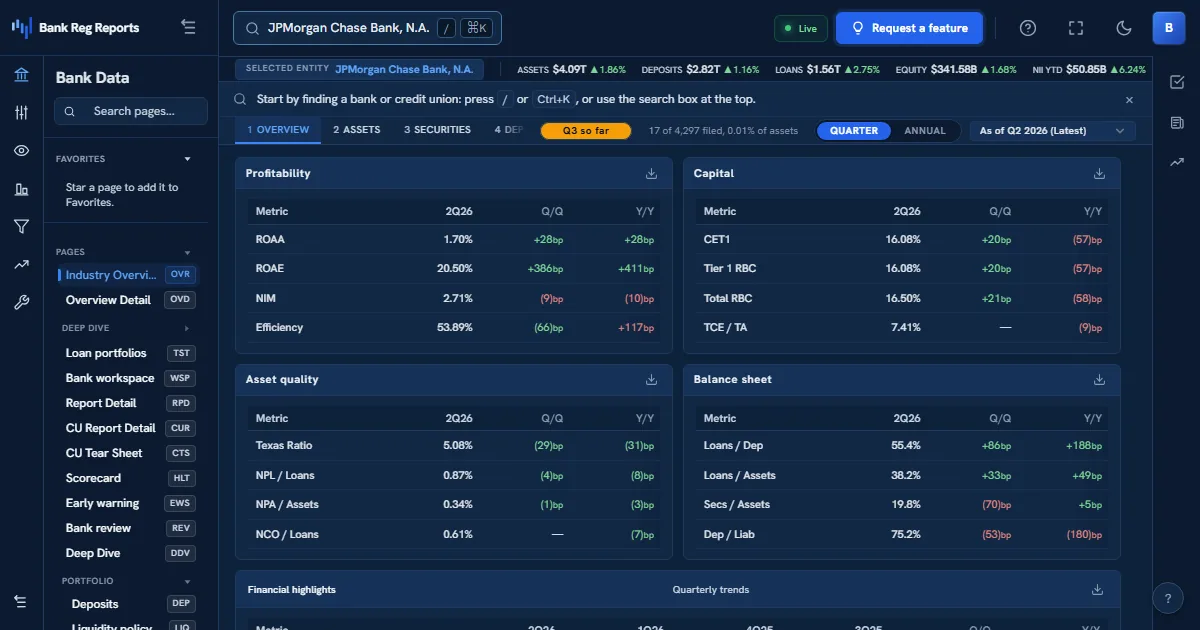
BRR Terminal overview showing profitability, capital, and asset-quality panels with quarter-over-quarter and year-over-year deltas and a total-assets-versus-ROAA trend for a bank.

Every fundamental before it's priced in

ROAA, ROAE, NIM, efficiency, CET1 and Texas Ratio with quarter-over-quarter and year-over-year deltas and multi-quarter trends, drawn from 892 standardized measures per bank: the fundamental picture that drives bank valuation, with per-bank CSV export on the Pro plan.

View rankings →

Frequently asked questions

Can I export data for my own model?

Yes, on the Pro plan. Pro exports any bank's metric history to CSV and generates formatted Excel tear sheets for individual institutions.

Does it cover unrealized securities losses?

Yes, the securities analysis views surface AOCI and held-to-maturity vs. available-for-sale positioning, which became central to bank risk after 2022.

Can I screen the entire sector on a single ratio?

Yes. Screen every FDIC-insured bank on capital, profitability, growth, funding, and credit metrics to build a long or short shortlist in seconds, then rank the leaders and laggards to find the tails of the distribution.

How many years of history can I pull into a model?

Standardized quarterly panels reach back to Q1 2000, more than 26 years, with glossary-defined metrics, so you can model full credit cycles, not just the latest print. Some series start later or change meaning: CET1 begins in 2015, and CECL changed how the allowance is measured as banks adopted it from 2020 to 2023.
See it on your bank

Every FDIC-insured institution, 26+ years of standardized data, one search away.